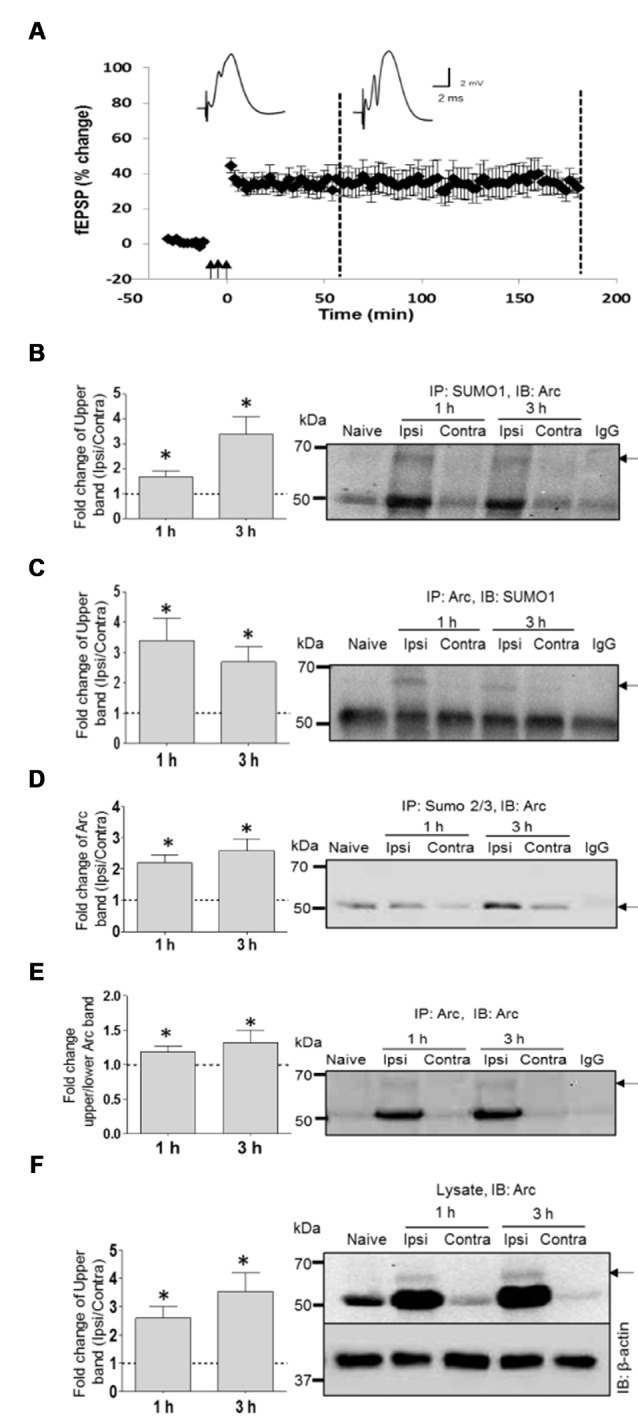
Figure 2.

SUMO1ylation of endogenous Arc following in vivo long-term potentiation (LTP) induction. (A) Time course plots of medial perforant path-dentate gyrus evoked field excitatory postsynaptic potential (fEPSP) recorded before and after high-frequency stimulation (HFS; indicated by arrows). Values are mean ± SEM of the maximum fEPSP slope expressed in percent of baseline. Test pulses were applied at a 0.033 Hz. HFS (3 × 400 Hz bursts) as indicated by the arrows. Rats were killed at 1 h and 3 h post-HFS (stippled line) and dentate gyrus was microdissected for biochemical analysis. (B–F) Coimmunoprecipitation analysis of dentate gyrus extracts. Bar graphs (left panels) based on densitometric analysis of indicated bands expressed as fold change in the ipsilateral HFS-treated dentate gyrus relative to the contralateral, non-stimulated side. Right panels show representative immunoblots from LTP experiments and naïve dentate gyrus. IgG lane is IgG-coupled beads plus lysate from HFS-treated dentate gyrus. (B) SUMO1 immunoprecipitation (rabbit polyclonal) followed by immunoblotting with Arc C7 antibody. Quantification of upper band (SUMOylated Arc). (C) Arc immunoprecipitation followed by SUMO1 immunoblot. Quantification of upper band (SUMO-Arc). The band at 50 kDa is non-specific (IgG). (D) SUMO2/3 immunoprecipitation followed by Arc immunoblot. (E) Arc immunoprecipitation (H300) followed by Arc (C7) immunoblot. Fold change in Arc SUMOylated state based on upper/lower Arc band intensity. (F) Arc immunoblot in dentate gyrus lysate input samples. β-Actin was used as a loading control. n = 4/5; Student’s t-test, *P < 0.05.
