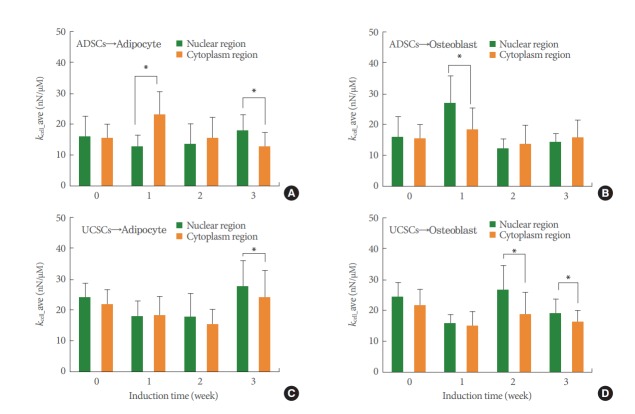
Fig. 4.
Averaged stiffness values of ADSCs (A, B) and UCSCs (C, D) differentiated into adipocytes and osteoblasts, respectively. Green and orange color bars indicate the results for the nuclear regions and the cytoplasm, respectively. MSCs, mescenchymal stem cells; ADSCs, adipose-derived MSCs; UCSCs, umbilical cord-derived MSCs. *P<0.05 for stiffness of the nuclear region compared with that of the cytoplasm. Error bars indicate the mean±standard deviation. **P<0.05, 2-way analysis of variance.

