. 2017 Jan 17;8(4):2776–2781. doi: 10.1039/c6sc05646f

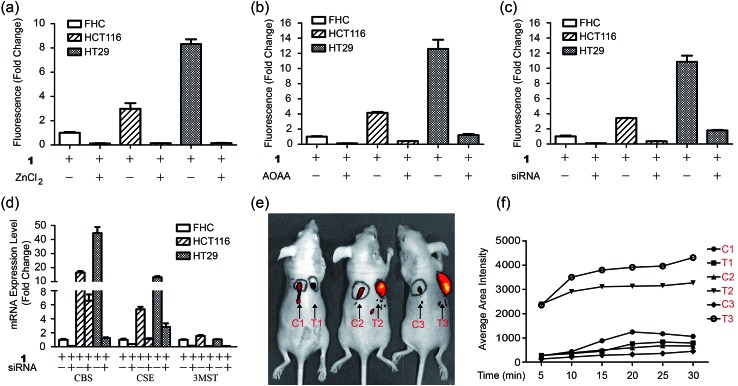
Fig. 5. Fluorescence imaging of endogenous H2S in CBS-overexpressed cancer cells in mice. (a) Average fluorescence of images of living cells (FHC, HCT116, HT29) in the presence or absence of ZnCl2. (b) Average fluorescence of images of living cells in the presence or absence of inhibitor AOAA. (c) Average fluorescence of images of living cells in the presence or absence of siRNAs. (d) The mRNA expression level for H2S-produced enzymes in three cells lines in the presence or absence of siRNAs. (e) In vivo fluorescence images of mice with skin-pop (s.p.) or intratumoral injection of probe 1. The left injection positions (C1, C2, C3) were for control purposes, while the right injection positions (T1, T2, T3) were for FHC, HCT116, and HT29 grafted cell positions. Observed tumors were formed in the HCT116 (T2) and HT29 (T3) xenograft mice. (f) The time-dependent average fluorescence of C1–C3, T1–T3 positions in mice in panel (e).

Fig. 5