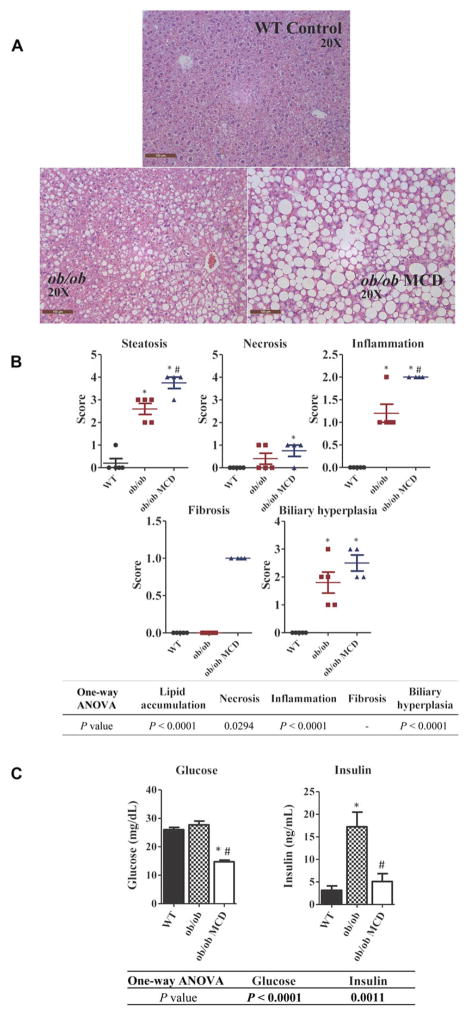
FIGURE 1.
Histological and pathological features of NASH in WT, ob/ob, and ob/ob MCD mice. Pictures of representative H&E-stained liver sections from WT, ob/ob, and ob/ob MCD mice were taken in original magnification of 20× (A). Histopathological analysis of liver from WT, ob/ob, and ob/ob MCD mice on steatosis, necrosis, inflammation, fibrosis, and biliary hyperplasia (B). Plasma collected from WT, ob/ob, and ob/ob MCD mice was analyzed for peripheral blood glucose and insulin concentrations (C). Data represent mean ± SEM. WT n = 5, ob/ob n = 5, ob/ob MCD n = 5. One-way ANOVA with Tukey’s multiple comparisons posttest were performed to determine the statistical significance. * Indicates a significant difference between ob/ob and/or ob/ob MCD with WT mice, whereas # indicates a significant difference between ob/ob and ob/ob MCD mice.

