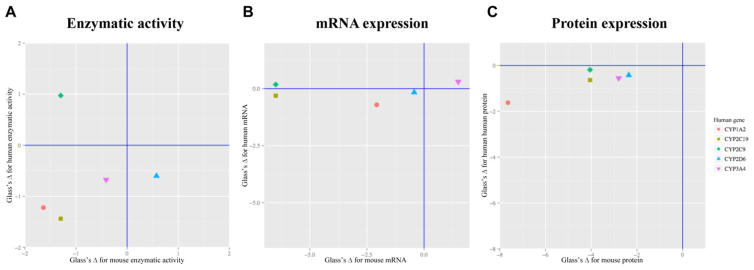
FIGURE 5.
Effective size analysis of ob/ob MCD mouse and human enzymatic activity, mRNA expression, and protein expression of five CYP isoforms. Comparison of effect size of human NASH on CYP isoform enzymatic activity (A), mRNA expression (B), and protein expression (C) changes versus the diabetic NASH mouse model changes. Positive effect reflects increase, whereas negative effect changes reflect decrease. The points in the lower left and upper right quadrant represent the same direction of changes, whereas the dots in the upper left or lower right quadrant represent the opposite direction of changes. Values were acquired by the method described in the Materials and Method section.

