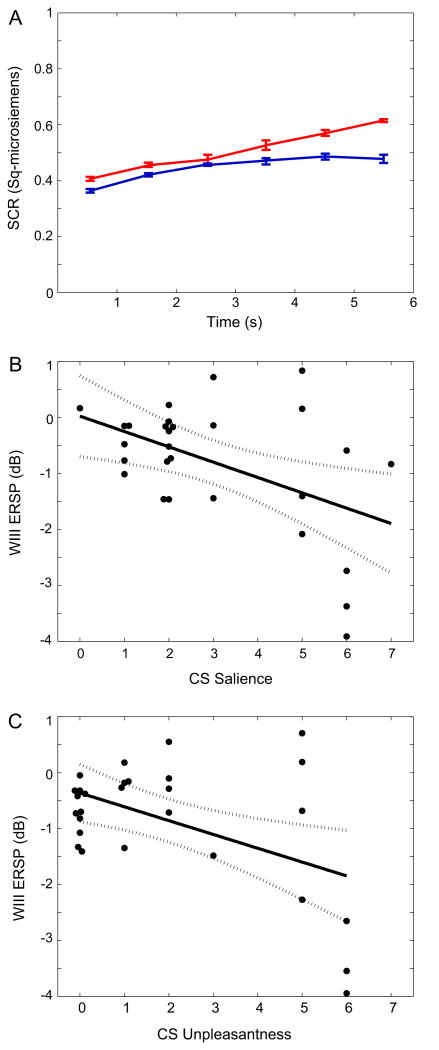
Fig. 7.
SCR and CS ratings during the behavioral protocol. (A) SCR at intervals after the CS+ (red line) and CS− (blue). (B) Plot of WIII ERD versus CS Salience across Subjects, Phases and Cues. (C) Plot of WIII ERD versus CS+ unpleasantness across CS, Phases and Cues. (For interpretation of the references to color in this figure legend, the reader is referred to the web version of this article.)

