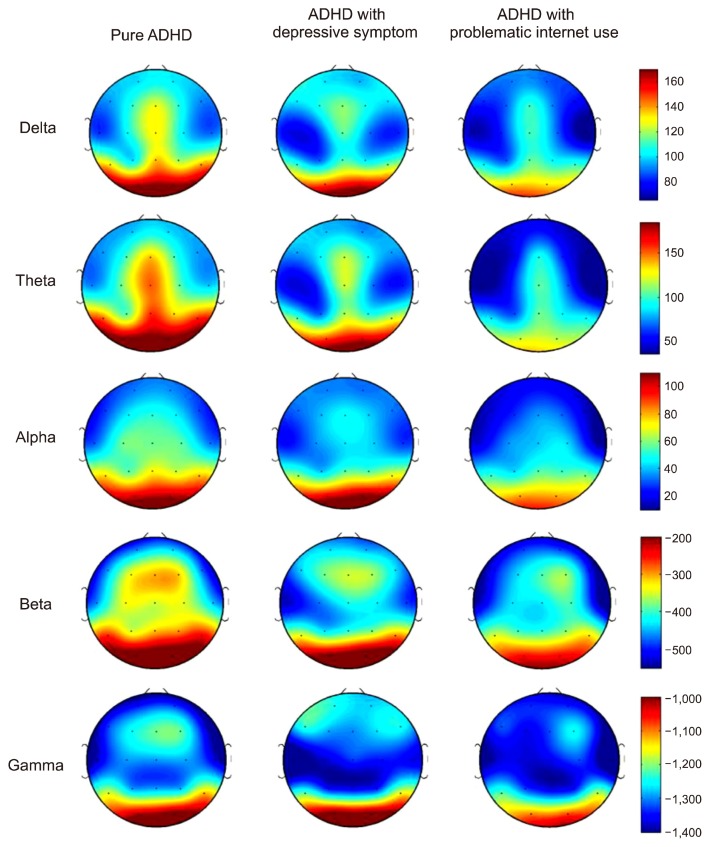
Fig. 1.
Topographical maps of absolute power among groups. Scale shows μV2 for absolute power. Red color represents higher value; blue color represents lower value. The attention deficit/hyperactivity disorder (ADHD) with problematic internet use group demonstrates reduced absolute power in the theta band compared with the pure ADHD group.

