Fig. 1.

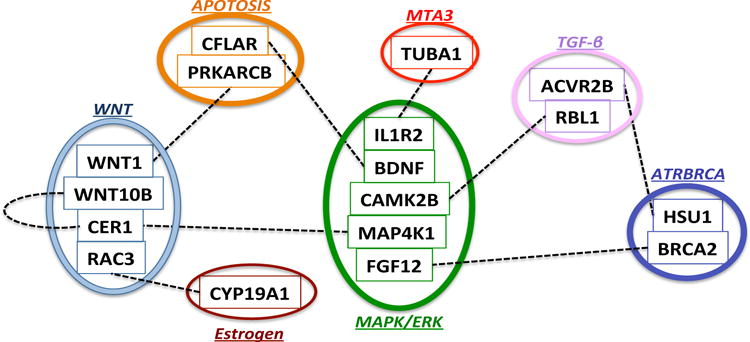
Identified gene-by-gene interactions for the breast cancer example. The dashed lines between gene-paris represent detected interactions. Genes inside each circle belong to the same pathway whose name is also shown.

Identified gene-by-gene interactions for the breast cancer example. The dashed lines between gene-paris represent detected interactions. Genes inside each circle belong to the same pathway whose name is also shown.