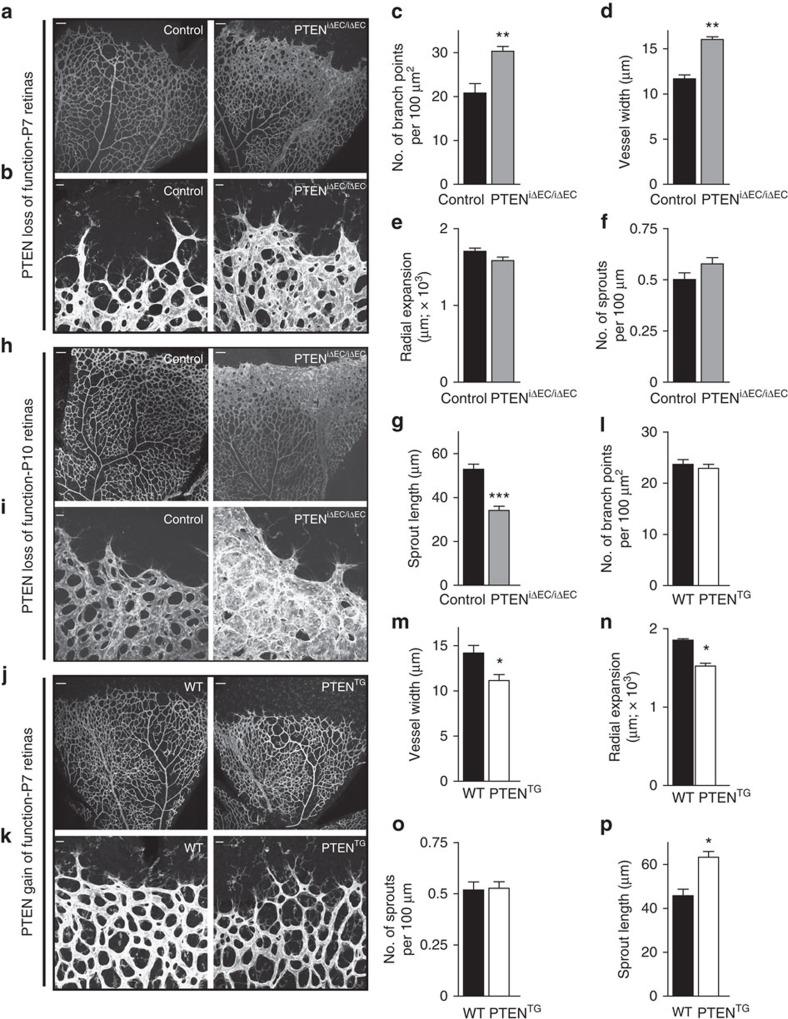
Figure 1. PTEN regulates vascular density.
(a,b) Whole-mount visualization of blood vessels by isolectin B4 (IB4) staining of control and PTENiΔEC/iΔEC littermates at P7. (c–g) Quantitative analysis of the retinas shown in a,b. (c) Vascular branch points per unit area (n≥6). (d) Vessel width (n≥4). (e) Radial expansion of blood vessels (n≥7). (f) Number of sprouts per vascular front length (n≥7). (g) Sprout length from the tip to the base of the sprout (n≥7). (h,i) Whole-mount visualization of blood vessels by IB4 staining of control and PTENiΔEC/iΔEC littermates at P10. (j,k) Whole-mount visualization of blood vessels by IB4 staining of WT and PTENTG littermates at P7. (l–p) Quantitative analysis of the retinas shown in j,k. (l) Vascular branch points per unit area (n=8). (m) Vessel width (n=12). (n) Radial expansion of blood vessels (n=4). (o) Number of sprouts per vascular front length (n=6). (p) Sprout length from the tip to the base of the sprout (n=6). Scale bars, 100 μm (a,h,j) and 20 μm (b,i,k). Error bars are s.e.m. *P<0.05, **P<0.01 and ***P<0.001 were considered statistically significant. Statistical analysis was performed by nonparametric Mann–Whitney test.

