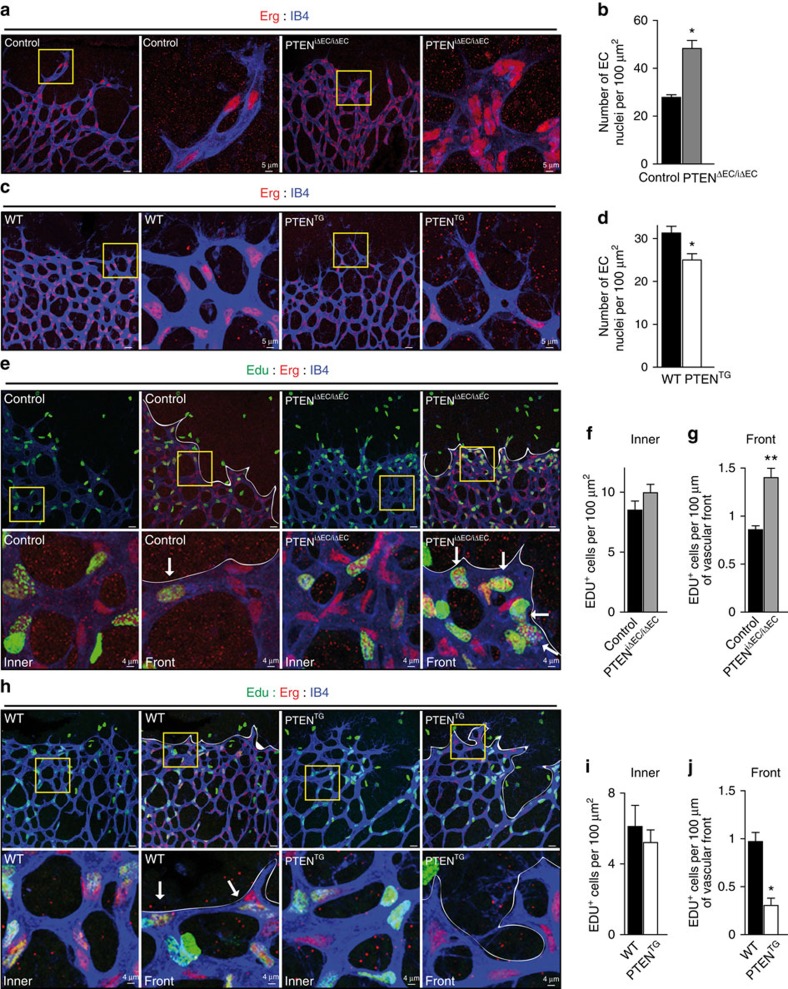
Figure 2. PTEN negatively regulates stalk cell proliferation.
(a) IB4 (blue) and Erg (red) staining of control and PTENiΔEC/iΔEC littermate retinas at P7. Islets show higher magnification of selected regions shown to the right. (b) Quantification of EC nuclei per unit area assessed by Erg positivity in control and PTENiΔEC/iΔEC P7 retinas (n≥4). (c) IB4 (blue) and Erg (red) staining of WT and PTENTG littermate retinas at P7. Islets show higher magnification of selected regions shown to the right. (d) Quantification of EC nuclei per unit area assessed by Erg positivity in WT and PTENTG P7 retinas (n=8). (e) IB4 (blue), Erg (red) and Edu (green) staining of control and PTENiΔEC/iΔEC P7 retinas. Islets show higher magnification of selected regions shown below. Arrows indicate Edu-positive ECs in the sprouting front. (f) Quantification of Edu-positive cells per unit area assessed in control and PTENiΔEC/iΔEC P7 retinas (n≥7). (g) Quantification of number of Edu-positive cells located at the sprouting front expressed per vascular front length in control and PTENiΔEC/iΔEC P7 retinas (n=7). (h) IB4 (blue), Erg (red) and Edu (green) staining of WT and PTENTG littermate retinas at P7. Islets show higher magnification of selected regions shown below. Arrows indicate Edu-positive ECs in the sprouting front. (i) Quantification of Edu-positive cells per unit area assessed in WT and PTENTG P7 retinas (n=4). (j) Quantification of number of Edu-positive cells located at the sprouting front expressed per vascular front length in WT and PTENTG retinas (n=4). Scale bars, 20 μm (a,c,e,h). Error bars are s.e.m. *P<0.05 and **P<0.01 were considered statistically significant. Statistical analysis was performed by nonparametric Mann–Whitney test.

