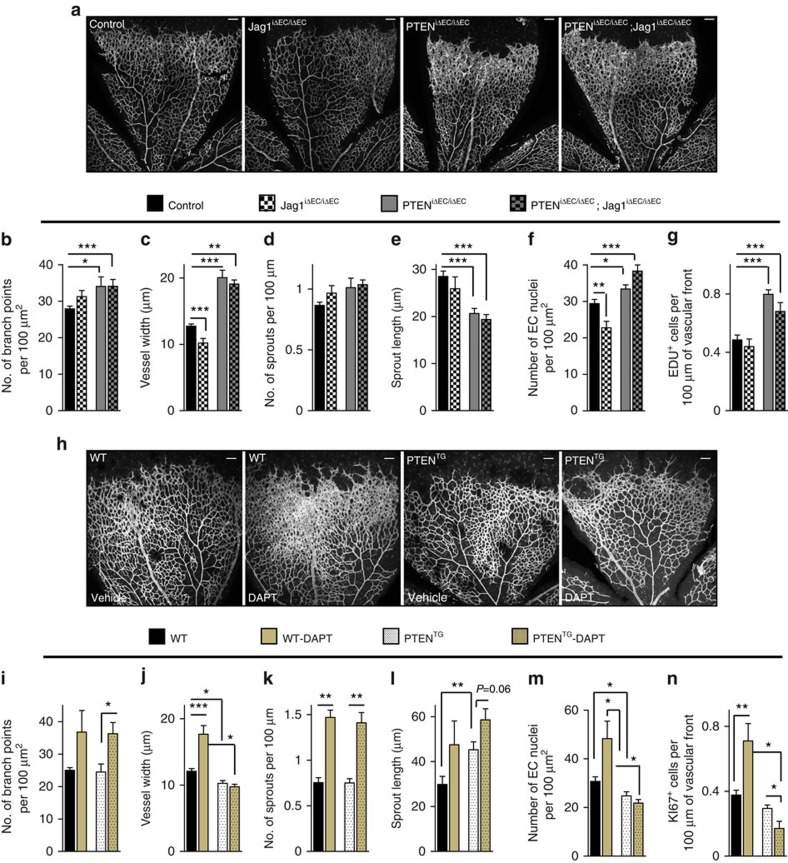
Figure 4. PTEN interacts with Notch in vivo to negatively control stalk cell proliferation.
(a) Whole-mount visualization of blood vessels by IB4 staining of control, Jag1iΔEC/iΔEC, PTENiΔEC/iΔEC and PTENiΔEC/iΔEC; Jag1iΔEC/iΔEC littermates at P7. (b–g) Quantitative analysis of the retinas shown in a. Retinas from five independent litters were pooled for quantification. (b) Vascular branch points (n≥4). (c) Vessel width (n≥4). (d) Number of sprouts per vascular front length (n≥4). (e) Sprout length from the tip to the base of the sprout (n≥4). (f) Quantification of EC nuclei per unit area assessed by Erg positivity (n≥4). (g) Quantification of number of Edu-positive cells located at the vascular front expressed per sprouting front length (n≥3). (h) Whole-mount visualization of blood vessels by IB4 staining of WT and PTENTG P7 retinas treated with vehicle or DAPT (100 mg kg−1). (i–n) Quantitative analysis of the retinas shown in h. Retinas from three independent litters were pooled for quantification. (i) Vascular branch points per unit area (n≥4). (j) Vessel width (n≥4). (k) Number of sprouts per vascular front length (n≥4). (l) Sprout length from the tip to the base of the sprout (n≥4). (m) Quantification of endothelial nuclei per unit area assessed by Erg positivity (n≥4). (n) Quantification of number of Ki67-positive cells located at the vascular front expressed per sprouting front length (n=6). Scale bars, 100 μm (a,h). Error bars are s.e.m. *P<0.05, **P<0.01 and ***P<0.001 were considered statistically significant. Statistical analysis was performed by nonparametric Mann–Whitney test.

