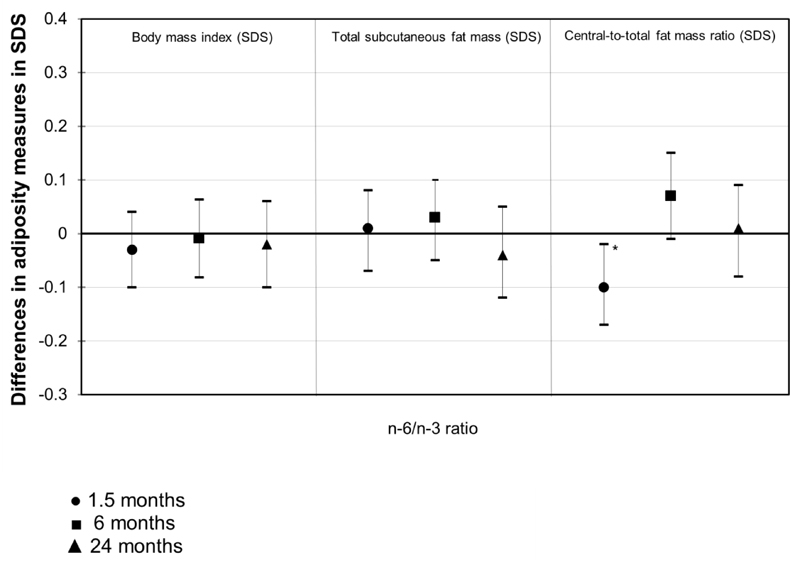
Figure 1. Maternal n-6/n-3 PUFA ratio and infant fat mass measures at 1.5, 6 and 24 months (N =904).
Values are regression coefficients (95% Confidence Interval) that reflect the difference in SDS of infant body mass index and subcutaneous fat mass measures at 1.5, 6 and 24 months per SD change in maternal n-6/n-3 PUFA ratio. Body mass index = weight/height2. Total subcutaneous fat mass = biceps + triceps + suprailiacal + subscapular skinfold thicknesses. Central-to-total subcutaneous fat mass ratio = (suprailiacal + subscapular skinfold thicknesses)/total subcutaneous fat mass. Models are adjusted for gestational age at blood sampling, maternal age, educational level, parity, pre-pregnancy body mass index, maternal total energy intake, smoking habits and weight gain during pregnancy, folic acid supplement use, gestational diabetes, gestational hypertensive disorders, infants’ sex, gestational age-adjusted birth weight standard-deviation scores, breastfeeding duration and timing of introduction of solid foods (for 6 and 24 months). *P-value<0.05.

