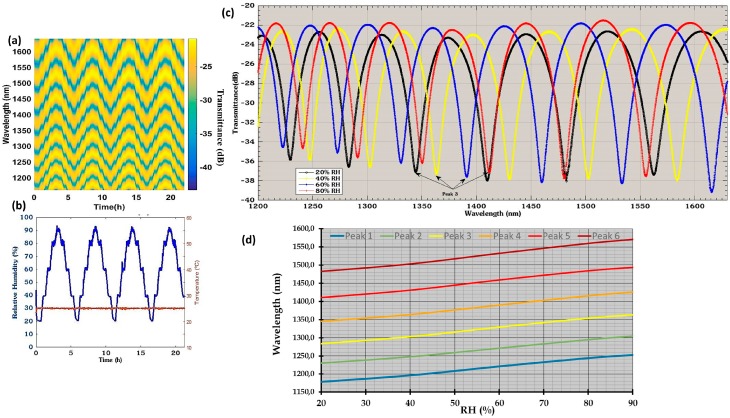
Figure 12.
(a) Evolution of the reflected spectra for (b) several cycles of changing RH. (c) Reflected spectra for different values of RH and (d) wavelength of interference plotted as a function of RH. Reprinted from [77] with permission of Springer International Publishing.

