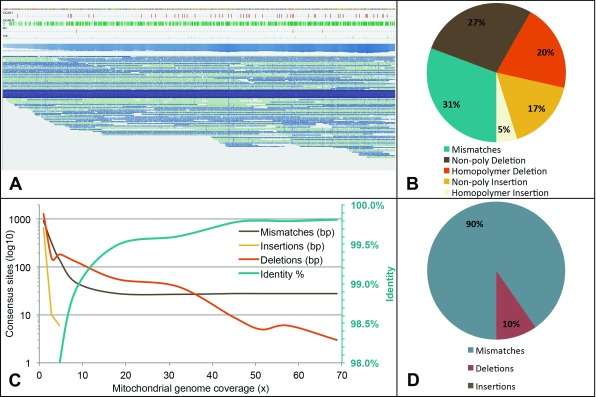
Figure 3. Mitochondrial genome coverage and consensus quality.
( A) Snapshot from Tablet, displaying the long reads mapping across the entire mitochondrial genome. Single reads covering the entire length are represented in dark blue. Several tracks also display (from the top) reference sequence, insertion sites (red), deletion sites (green), consensus deletions (orange), consensus mismatches (light green) and coverage. ( B) Breakdown of the different error types as estimated by AlignQC for the mitochondrial mapping only. ( C) Change in error counts (on a log 10 scale) and percent identity of the final mitochondrial consensus sequence over a range of coverage levels downsampled from the full alignment. Note the percent identity scale is to the right of the graph in green. ( D) Breakdown of the basic error types remaining in the final full coverage consensus.

