Figure 3.
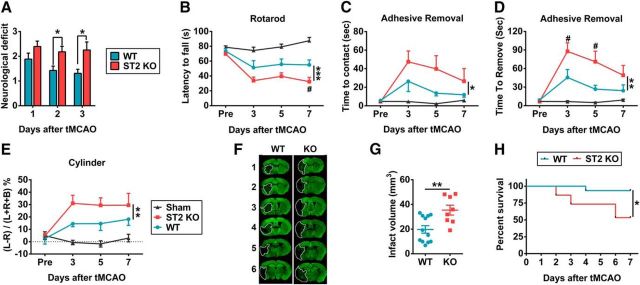
ST2 deficiency exacerbates neurobehavioral deficits and brain damage up to 7 d after tMCAO. A, ST2 loss worsened neurological deficits over 3 d after tMCAO (n = 13–14 per group, 2-tailed Mann–Whitney U test). B–E, Sensorimotor function was evaluated up to 7 d after tMCAO in ST2 KO and WT mice. B, Rotarod test. Data are expressed as the duration on the Rotarod. n = 9–12 per group (repeated-measures ANOVA). C, D, Adhesive removal test. Data are expressed as the latency to contact (C) and remove (D) the tape from the impaired forepaw. n = 10–12 per group (repeated-measures ANOVA). E, Cylinder test. The number of left, right, or bilateral forepaw contacts were counted, and performance asymmetry was expressed as follows: (left − right) / (left + right + both) × 100% paw use in 10 min. n = 8–12 per group (repeated-measures ANOVA). F, Representative MAP2-stained coronal sections illustrate larger infarct sizes in ST2 KO mouse brains, compared with WT mouse brains at 7 d after tMCAO. Dotted lines encompass infarct zone. G, Infarct volumes in WT and ST2 KO mouse brains at 7 d after tMCAO (n = 8–12 per group, 2-tailed Student's t test). H, 7 d survival rate. ST2 KO mice exhibited lower 7 d survival rates after tMCAO, compared with WT mice (n = 15 per group). Data are mean ± SEM. *p < 0.05, **p < 0.01, ***p < 0.001 versus WT.

