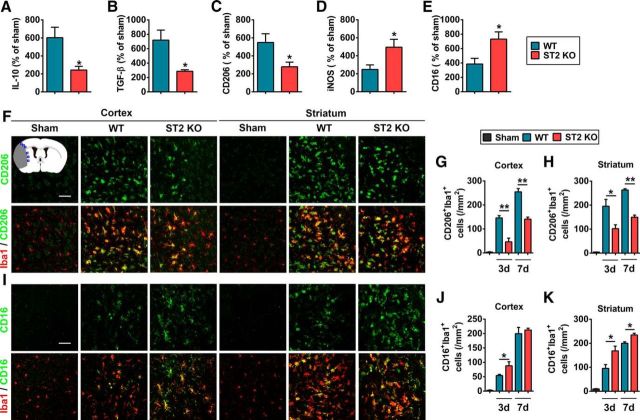
Figure 6.
ST2 deficiency shifts microglial polarization toward M1 at 3 and 7 d after tMCAO. A–E, mRNA expression of M2 markers (A, IL-10; B, TGF-β; C, CD206) and M1 markers [inducible nitric oxide synthase (D, iNOS); CD16 (E)] were quantified by RT-PCR in the WT and ST2 KO brain at 3 d after tMCAO or sham operation. Data are expressed as percentage of sham. n = 4 per group. *p < 0.05 versus WT group (2-tailed Student's t test). F, Representative images of double immunofluorescent staining for microglia/macrophage marker Iba1 with M2 marker CD206 in the cortex and striatum of sham, WT tMCAO, and ST2 KO tMCAO mice at 3 d after surgery. Blue squares in the schematic diagram illustrate the anatomical location of images in F and I in ipsilateral peri-infarct regions. Scale bar, 50 μm. G, H, The number of CD206+Iba1+ microglia/macrophage was quantified in ipsilesional cortex (left) and striatum (right) 3 and 7 d after tMCAO. n = 3–4 per group. I, Representative images of double immunofluorescent staining for microglia/macrophage marker Iba1 with M1 marker CD16 in the cortex and striatum of sham, WT MCAO, and ST2 KO tMCAO mice at 3 d after surgery. Scale bar, 50 μm. J, K, The number of CD16+Iba1+ microglia/macrophages was quantified in ipsilesional cortex (left) and striatum (right) 3 and 7 d after tMCAO. n = 4–5 per group. Data are mean ± SEM. *p < 0.05, **p < 0.01 versus WT group (2-tailed Student's t test).

