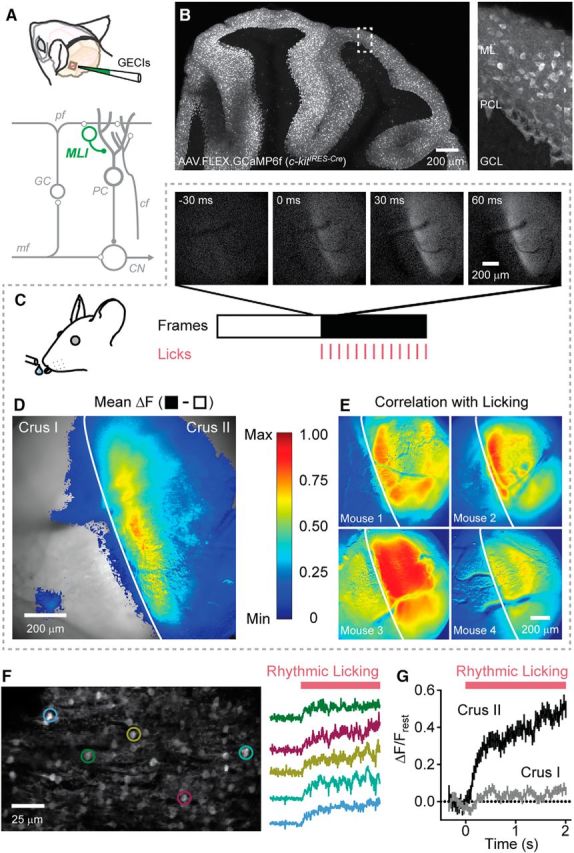
Figure 1.

Movement-related Ca2+ activity in MLIs in the lateral cerebellum. A, Illustration of the cranial window location and injection site for AAVs containing Cre-dependent genetically encoded Ca2+ indicators. At the bottom, a simplified circuit diagram of the cerebellum is shown, with MLIs highlighted in green. pf, parallel fiber; GC, granule cell; PC, Purkinje cell; mf, mossy fiber; cf, climbing fiber; CN, cerebellar nuclei. B, Sagittal view of viral-mediated GCaMP6f expression in the cerebellar cortex of a c-kitIRES-Cre mouse. A higher-magnification view of the boxed region is shown on the right. ML, Molecular layer; PCL, Purkinje cell layer; GCL, granule cell layer. C, Select images from a time series collected using wide-field fluorescence microscopy (30 Hz) before and after (white and black regions, respectively) the mouse began licking (0 ms; licks are indicated by tick marks). D, Difference image (black minus white frames from C) showing the mean fluorescence change in the MLI population Ca2+ response induced by licking. Superimposed over the imaging location are ΔF values >0, color coded on a linear scale from minimum to maximum (normalized data) according to the scale bar on the right. The vertical white line demarcates the boundary between Crus I and Crus II. Data represent an average of four mice. E, Examples from four mice showing the correlation of each pixel value with licking (see Materials and Methods). Images are color-coded based on the scale bar to the left. F, High-resolution fluorescence image of GCaMP6f-expressing MLIs acquired using two-photon laser scanning microscopy. Fluorescence traces from individual cells, corresponding to color-coded ROIs, during the onset of rhythmic licking are shown on the right. G, Average Ca2+ response for MLIs in either Crus II (black line; n = 240 cells from 3 mice) or Crus I (gray line; n = 240 cells from 4 mice) during rhythmic licking. In half of the trials (120 cells from 2 mice), both lobules were imaged simultaneously.
