Figure 2.
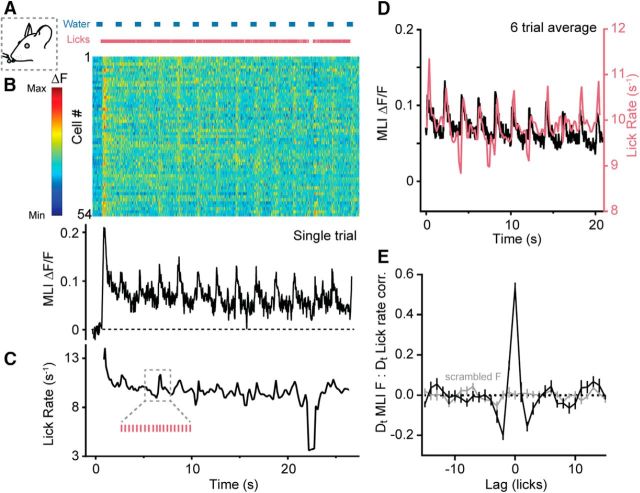
Transient increases in MLI Ca2+ activity during sustained licking. A, During a single trial of the task, water was dispensed in regular intervals (blue bars) and the mouse licked continuously ad libitum. (Pink ticks mark individual licks as measured by contact with the lick port.) B, Activity measurements for individual MLIs in a field of view during the bout of sustained licking shown above. Changes in MLI fluorescence are normalized according to the color bar on the left. The average single-trial Ca2+ response for all cells is shown below. C, Plot of instantaneous lick rate derived from the same lick bout above. Inset, A magnified subsection showing detected licks. D, Average measurements of MLI Ca2+ activity (black) and lick rate (pink) from six trials of licking bouts from a single mouse. Data were selected from the midst of each bout due to inconsistencies in the lick initiation times across trials. E, Cross-correlation of the derivatives (Dt) of MLI Ca2+ activity and lick rate (black line). For scrambled fluorescence data, there was no apparent peak in the correlation (gray line). Data include 12 trials from three mice.

