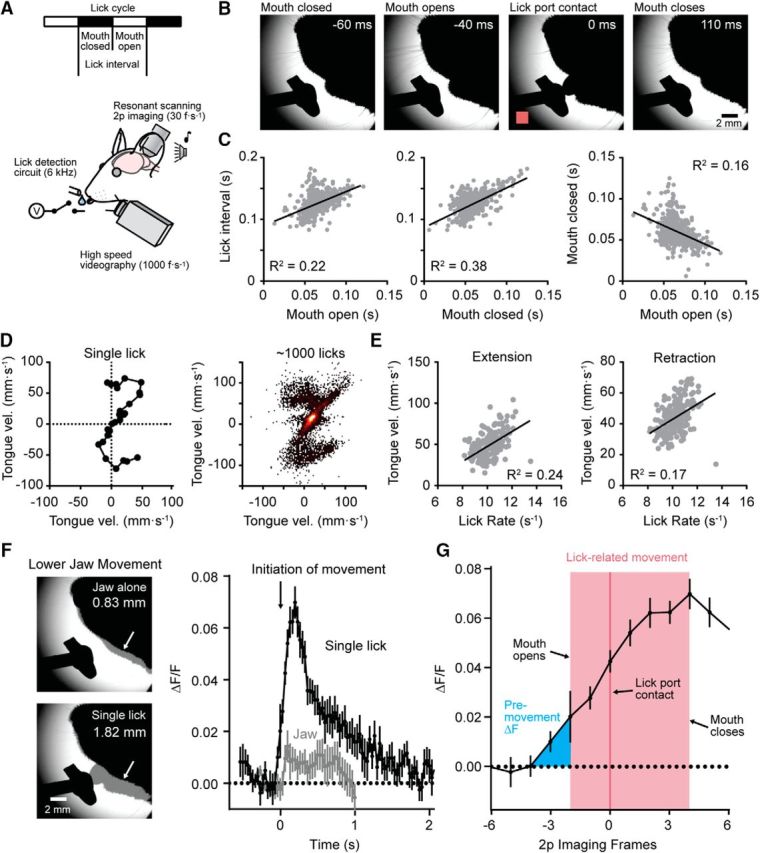
Figure 4.

Coordinated patterns of motor output during water consumption. A, Diagram depicting of the recording configuration including simultaneous acquisition of high-speed videography and two-photon Ca2+ imaging. B, Select video images showing the timing of distinct phases of movement during an individual lick in a bout of cued licking. Detection of the lick, registered using a lick-detection circuit (in pink; 0 ms), is apparent in the image as the tongue makes contact with the lick port. C, Plots showing the temporal coordination of distinct phases of licking. Shorter interlick intervals are associated with briefer epochs with the mouth open or closed, movement phases that covary in coordination with one another (data obtained from 608 licks, shown in gray, from 3 mice). D, Tracking tongue velocity during a single lick using images captured during high-speed videography. On the right, a heat map of velocity tracks from many licks across bouts from a representative mouse is shown. E, The relationship between average tongue velocity and lick rate during tongue extension (left) or tongue retraction (right). F, Left, Representative images showing maximum extent of lower jaw movements during a trial without a lick (top) or with a single lick (bottom). Arrows point to the grayed regions where the amplitude of the jaw movement was measured. Right, Plot comparing mean MLI Ca2+ activity during a single lick (black line) or during lower jaw movement alone (gray line). Both traces are aligned to the initiation of any visible movement. G, Plot showing the timing of MLI Ca2+ activity relative to the initiation of lick-related movement during an isolated lick. Timing is plotted based on the imaging frame obtained with resonant-scanning two-photon microscopy. Mouth opening and closing were determined from high-speed videography. Lick contact is registered from the detection circuit.
