Figure 6.

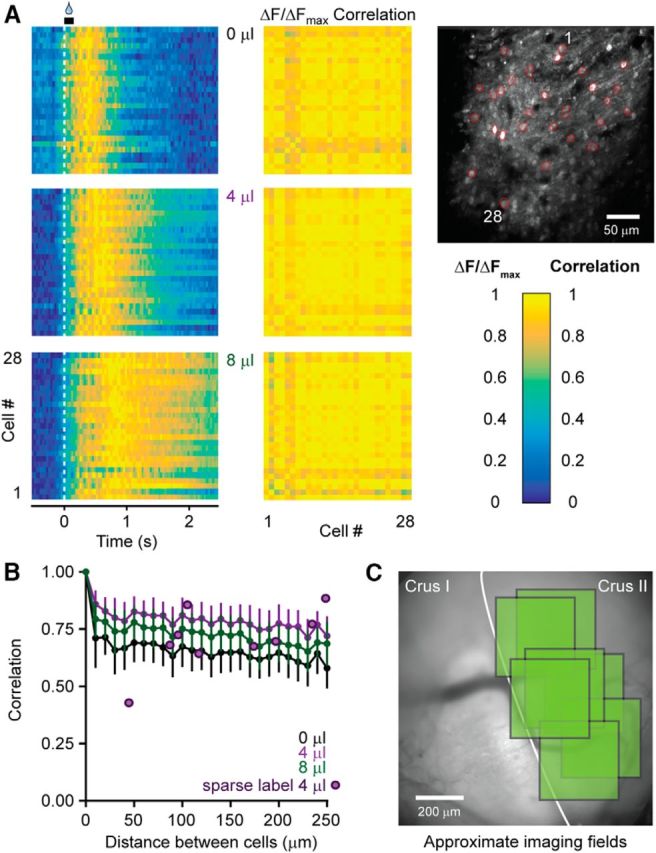
MLI activity is uniform across an ensemble. A, Relative fluorescence changes induced in MLIs during a session of cued licking for cells marked in red in the image on the right. Averaged responses were normalized according to the peak fluorescence across all water volumes. Cross-correlation plots show the high correspondence of MLI Ca2+ activity in the ensemble for all trial conditions. B, Plot of average cell-to-cell correlation values versus the distance between each cell pair (colored lines, n = 225 cells from 5 mice). Similar measurements were also obtained from a separate set of animals with sparsely labeled MLIs that lacked neuropil-associated fluorescence signals common in densely labeled tissue (purple dots, n = 9 cell pairs from 3 mice). C, Representative cranial window overlaying Crus I and Crus II with approximate imaging field locations used to evaluate correlated activity (7 fields of view, marked in green, from 5 mice).
