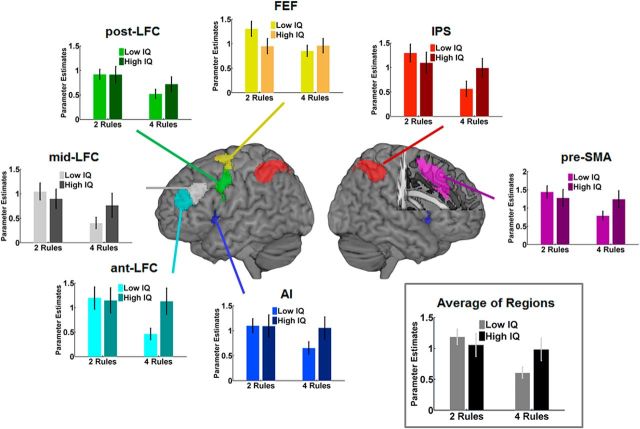
Figure 3.
fMRI results from multiple-demand network ROIs. Graphs plot the mean parameter estimates for targets and lures, separately for low IQ and high IQ groups during two-rule and four-rule conditions, averaged across hemispheres and stimulus types. The gray box presents the average of activation across all presented ROIs. Error bars indicate SEM.

