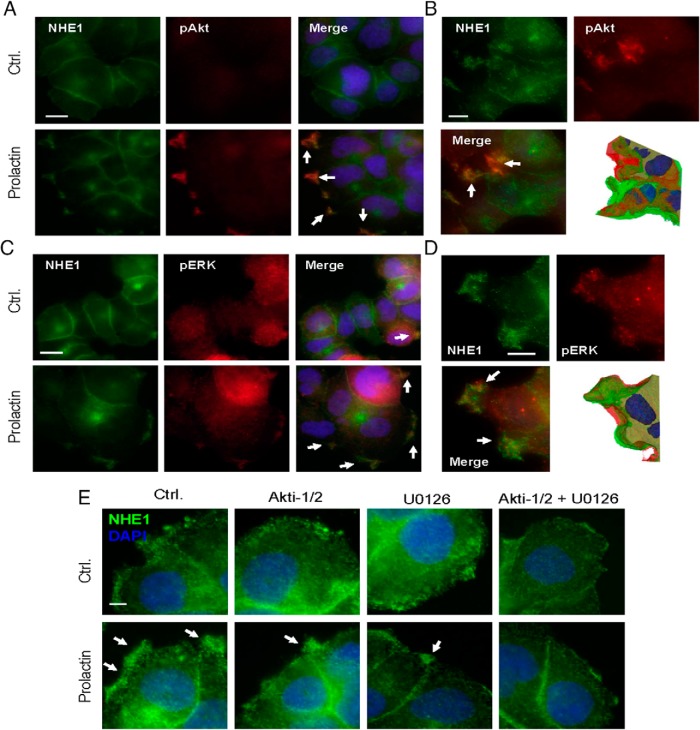
Figure 2. NHE1 colocalization with pAkt and pERK in PRL-induced ruffles.
Immunofluorescence analysis of T47D cells treated or not with PRL (10 nM, 5 min) and stained for NHE1, pSer473-Akt, pThr202/Tyr204-ERK1/2, and DAPI (nuclear stain, blue), as indicated. Arrows mark regions of prominent colocalization (A–D) or NHE1 localization to ruffles (E). A, NHE1 (green) and pSer473-Akt (red) colocalize in PRL-induced ruffles. Scale bar, 10 μm. B, z-stack imaging, maximal intensity projection, and isosurface projection show details of NHE1-p-Akt colocalization in ruffles. Note the strong p-Akt enrichment in ruffles seen in both panels A and B. Scale bar, 5 μm. C, NHE1 (green) and pThr202/Tyr204-ERK1/2 (red). D, z-stack imaging, maximal intensity projection and isosurface projection show details of NHE1-p-ERK colocalization in ruffles. Scale bar, 5 μm. Scale bar, 10 μm. E, T47D cells were treated with Akti-1/2 or U0126 10 μM for 1 hour, followed by treatment or not with PRL, as indicated, and stained for NHE1 (green) with DAPI nuclear counterstain. Scale bar, 10 μm. All images are representative of at least three independent experiments per condition. Ctrl, control.

