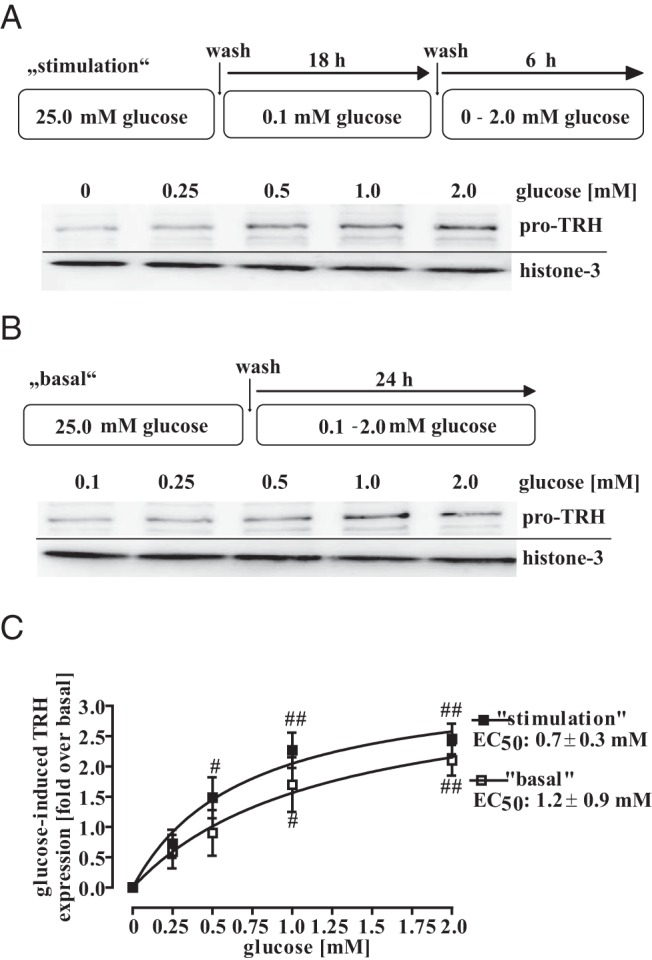
Figure 8. Glucose-induced TRH protein expression in hypothalamic cells.

A, Cells were cultured for 18 hours with 0.1mM glucose and afterwards with 0mM, 0.25mM, 0.5mM, 1.0mM, or 2.0mM glucose for additional 6 hours. B, Cells were cultured with 0mM, 0.25mM, 0.5mM, 1.0mM, or 2.0mM glucose for 24 hours. Lysates were subjected to Western blot analysis using either a specific antiserum against pro-TRH or against the total histone-3 protein to control for the total protein amount. One representative blot is shown. C, Data of 5 independent experiments were quantified by densitometry, ratios between TRH and histone signals calculated, glucose-induced TRH expression normalized to not stimulated cells (no glucose), and data fitted to a 1-site saturation curve to calculate the EC50 value. Hash signs indicate a significant difference to 0 fold over basal.
