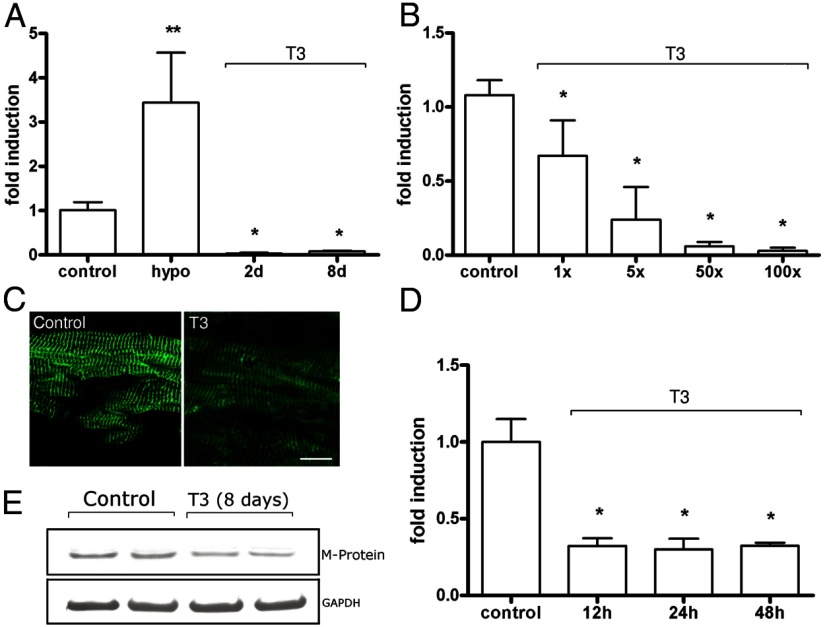
Figure 2.
M-protein mRNA and protein levels are decreased by T3. A, M-protein mRNA levels in euthyroid (control), hypothyroid (hypo) + T3 (100×) for 2 and 8 days (n = 5–6). Data are expressed as fold induction and control is arbitrarily set as 1. Bars represent mean, and the connected vertical lines represent SD. *, P < .05 vs control; **, P < .001 vs control. B, T3 induces repression of M-protein mRNA level in a dose-dependent manner. Rats were treated with increasing doses of T3 (1×, 5×, 50×, and 100× physiological doses) for 48 hours (n = 5–6). *, P < .001 vs control. C, Immunoexpression of M-protein in LV sections from rats treated with 100× of T3 for 8 days. Note decreased intensity of labeling (green) in T3-treated group as compared with control group; Bar, 20 μm. D, M-protein mRNA levels determined by real-time quantitative PCR in cultured cardiomyocytes. Cells were treated with T3 (10−7M) for 12 hours, 24 hours, or 48 hours. *, P < .001 vs control. E, Western blot analysis of T3-treated (8 days) rats show decreased M-protein expression compared with control.

