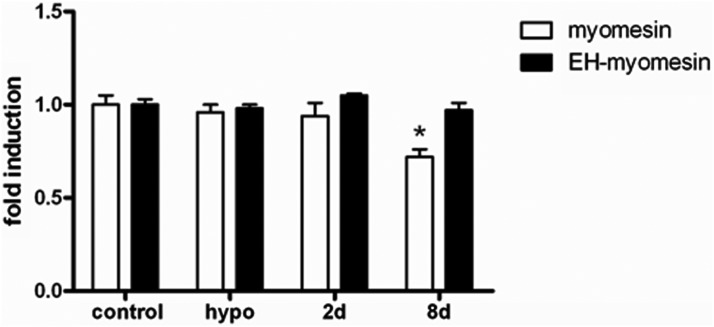
Figure 6.
T3 effect upon myomesin and EH-myomesin mRNA levels were determined by real time quantitative PCR. Data is expressed as fold induction (mean ± SD), and euthyroid group (control) is arbitrarily set as 1. Myomesin (open bars) and EH-myomesin (solid bars) mRNA levels in control, hypothyroid (hypo), and euthyroid rats treated with T3 for 2 and 8 days (100×) (n = 5–6). *, P < .001 vs control.

