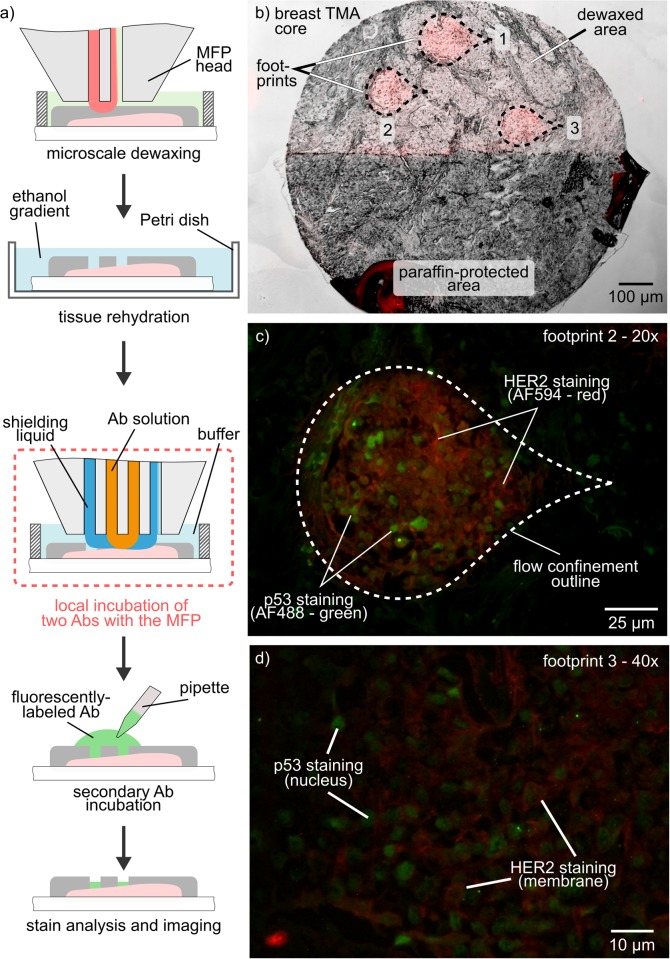
Fig 4. Micrometer-scale co-localization of IHC stains.
(a) Schematic of the workflow for localized dewaxing and antibody incubation with the MFP. (b) Overlay image of bright-field and fluorescence (red) images of a breast cancer tissue microarray. Half of the core was dewaxed, and three footprints were incubated with antibodies. (c,d) 20× and 40× images of local HER2-staining (membrane, red channel) and p53 (nucleus, green channel).

