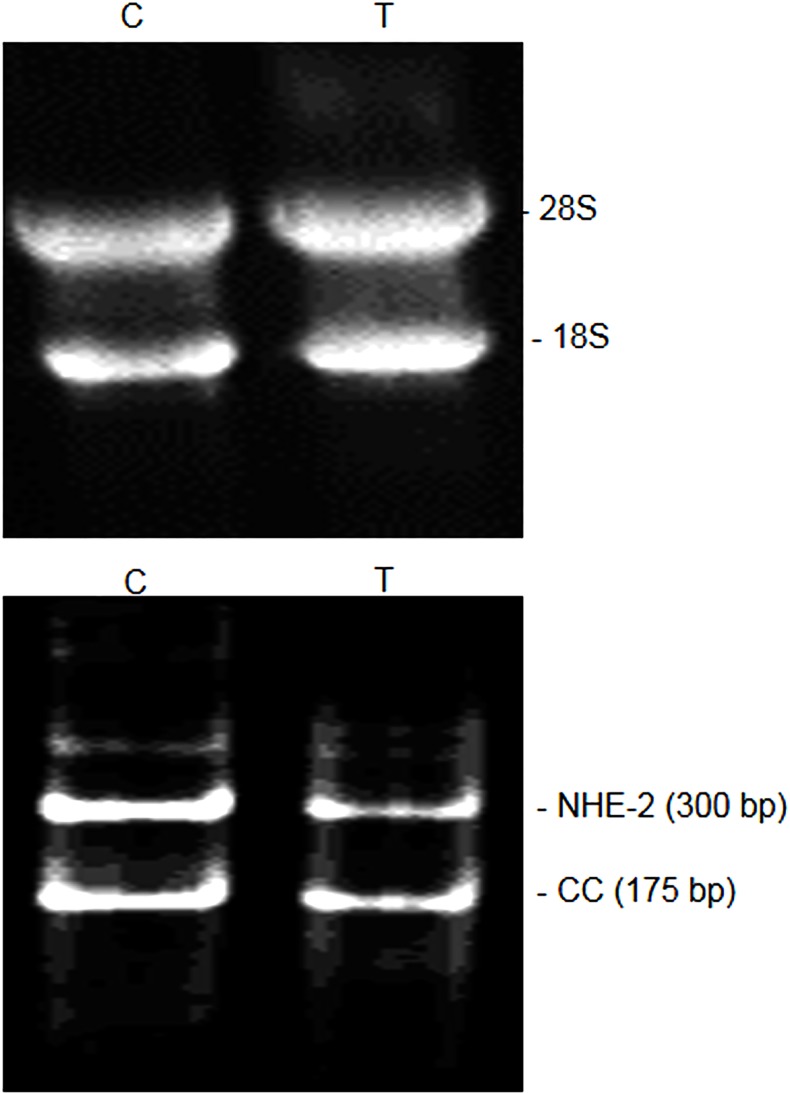
Fig 8. Agarose gel picture showing quality of total RNA extracted from the control (C) and colitis (T) colonic tissues used in this study.
The 28S and 18S bands are ribosomal RNA (upper panel). Expression of NHE-2 mRNA (300 bp) and the competitive control (CC, 175 bp) in the control (C) and TNBS inflamed (T) colon using the end-point RT-PCR method (lower panel).

