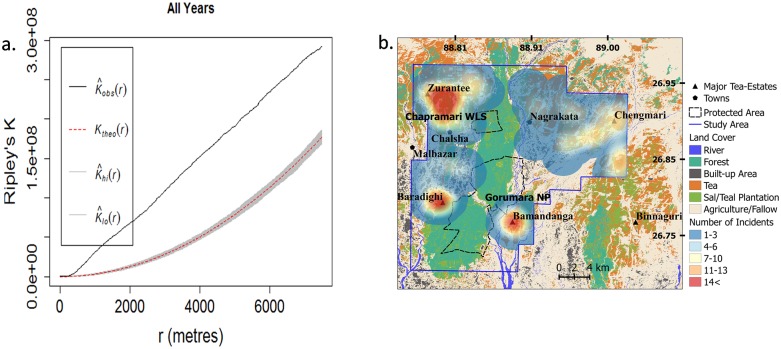
Fig 3. Maps showing (a) Ripley’s K Plots for clustering of attack locations and (b) clusters of location of leopard attack on people between January 2009 and March 2016 in northern West Bengal, India.
Kobs(r): Ripley’s k function of attack locations, Ktheo(r): Ripley’s K function for random process.

