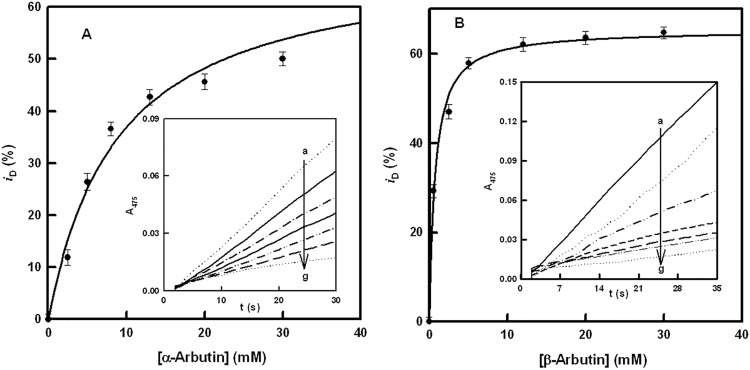
Fig 3. Diphenolase activity.
A. Representation of iD (degree of inhibition of the diphenolase activity) vs. the concentration of α-arbutin. The experimental conditions were [E]0 = 30 nM and [L-dopa]0 = 0.5 mM. Inset. Spectrophotometric recordings of the effect of different concentrations of α-arbutin on the diphenolase activity of tyrosinase, using L-dopa as substrate. The experimental conditions were [E]0 = 30 nM, [L-dopa]0 = 0.5 mM and α-arbutin (mM): a) 0, b) 2.5, c) 5, d) 8, e) 13, f) 20 and g) 30. B. Representation of iD (degree of inhibition of the diphenolase activity) vs. the concentration of β-arbutin. The experimental conditions were [E]0 = 30 nM and [L-dopa]0 = 0.5 mM. Inset. Spectrophotometric recordings of the effect of different concentrations of β-arbutin on the diphenolase activity of tyrosinase, using L-dopa as substrate. The experimental conditions were [E]0 = 30 nM, [L-dopa]0 = 0.5 mM and β-arbutin (mM): a) 0, b) 0.5, c) 2.5, d) 5, e) 12, f) 20 and g) 30.

