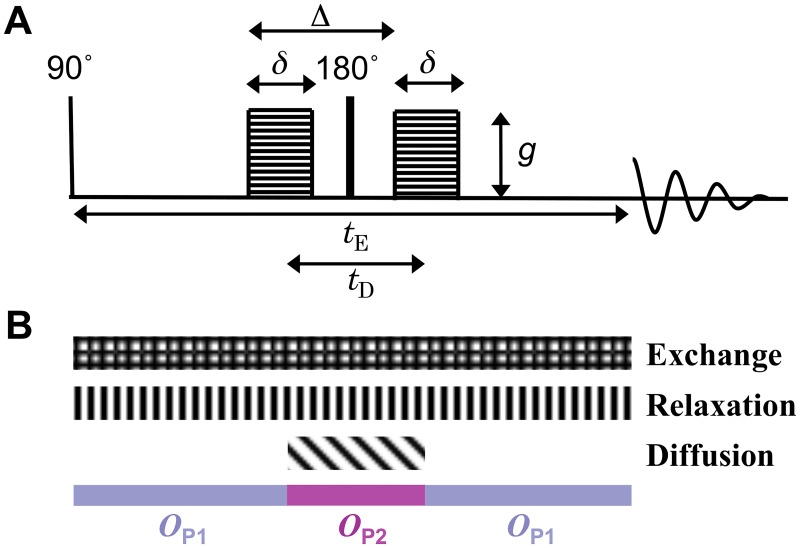
Fig 2. Schematic representation of the PGSE experiment.
(A) The PGSE pulse sequence with gradient pulse duration δ, interval between the onset of the gradient pulses Δ, effective diffusion encoding time tD, gradient strength g, and echo time tE. (B) The different patterned blocks mark the time intervals when the signal is subjected to the evolution operators for exchange, T2-relaxation and diffusion. The coloured blocks show the time intervals during which the operators defined in Eqs 9 and 10 apply.

