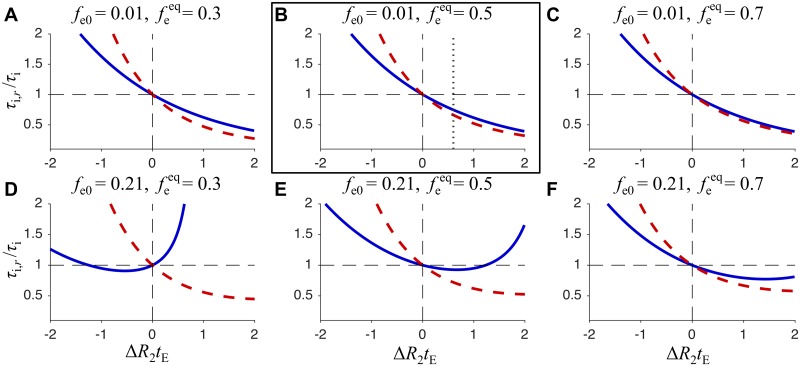
Fig 5. Relative bias of the intracellular lifetime as a function of ΔR2tE.
The ratio of τi,r/τi as a function of ΔR2tE, is shown for six different sets of fe0 and values. The solid blue lines are calculated from Eq 25, while the dashed red lines are calculated from Eq 24. The framed plot shows the bias from low fe0 and 50% extracellular fraction, which approximately corresponds to our experimental conditions. The vertical dotted line is at ΔR2tE = 0.6, which corresponds to echo time tE = 17 ms and the difference in relaxation rate constants ΔR2 = 35 s−1. Here the relative bias (solid blue line) is about −20%.

