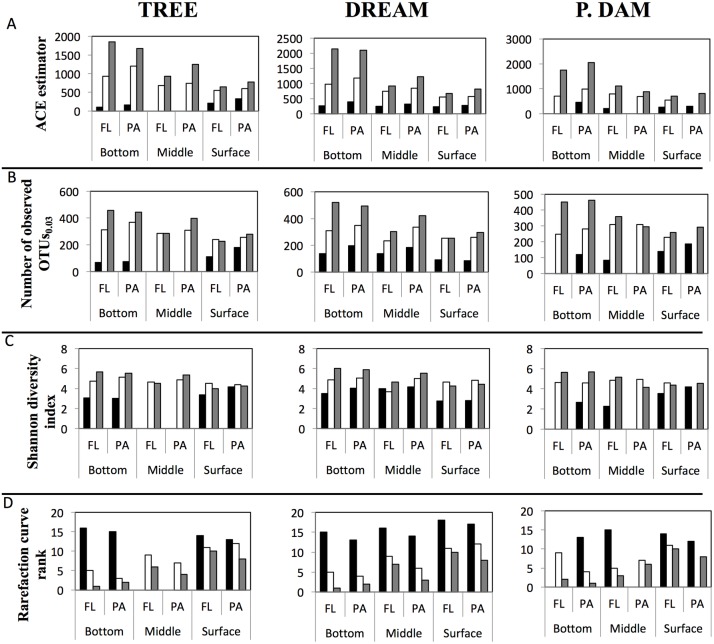
Fig 3. Diversity estimates calculated for each of the datasets obtained and shown for the three sites sampled in this study (site name is shown on top).
(A) ACE species richness estimator, (B) the number of observed OTUs 0.03, (C) Shannon diversity index (A-C all normalized to the number of sequences in the smallest dataset), and (D) rarefaction curve ranking (with 1 being the most diverse). Results are grouped first by sampling depth, then by the physical state of the sample (free-living (FL) versus particle-associated (PA)) and shown across the sampling season (March, Black bars; June, White bars; September, Grey bars).

