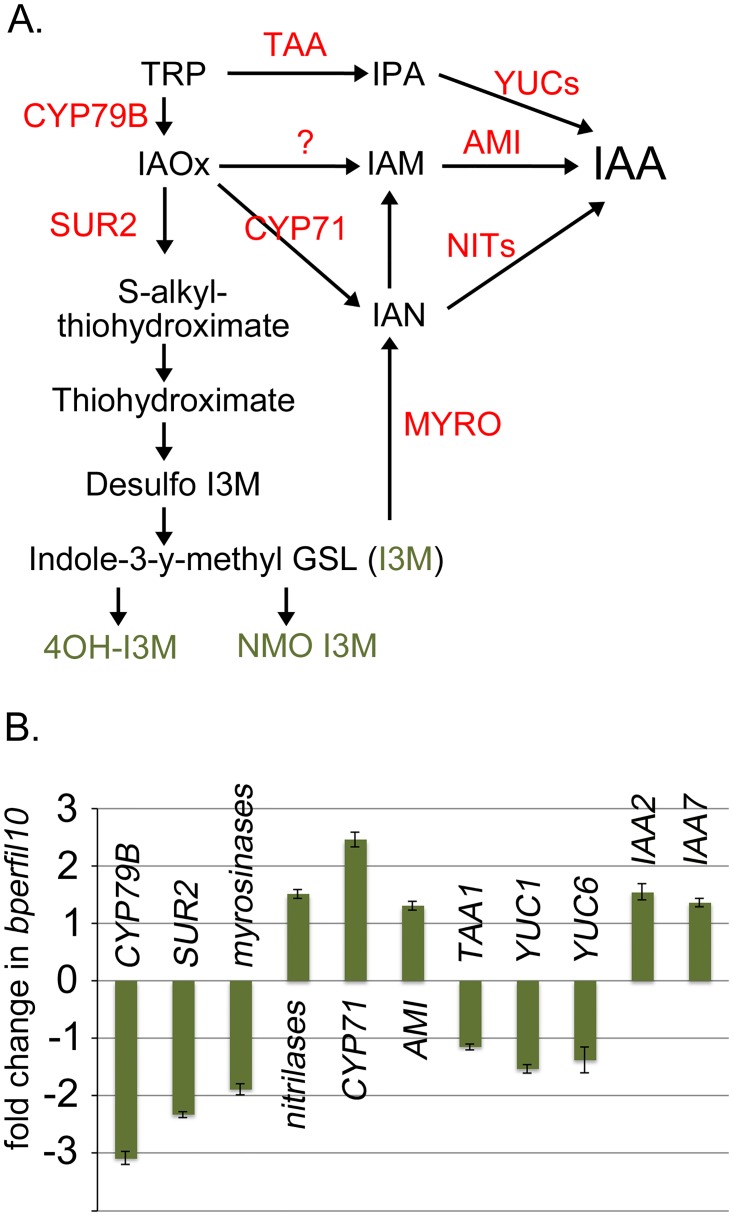
Fig 8. Changes in the expression of indolic glucosinolate and auxin biosynthesis genes in bp er fil-10.
(A) Inferred and speculative intersections of auxin and glucosinolate biosynthetic pathways. Some pathway steps are embellished with gene designations where empirical data implicate specific associations (red text). The green text identifies specific glucosinolate metabolites that are products of the enzymatic steps and for which quantitative analysis was performed (see Table 3). (B) QRT-PCR data on selected genes implicated in indolic glucosinolate and auxin metabolism. The relative level of transcripts in bp er fil-10 vs bp er is shown. Error bars represent standard error of the mean. Pairwise t-tests on linear transformed ΔCt revealed all differences to be statistically significant (p<0.02) except YUC1 (p = 0.069) and YUC6 (p = 0.55).

