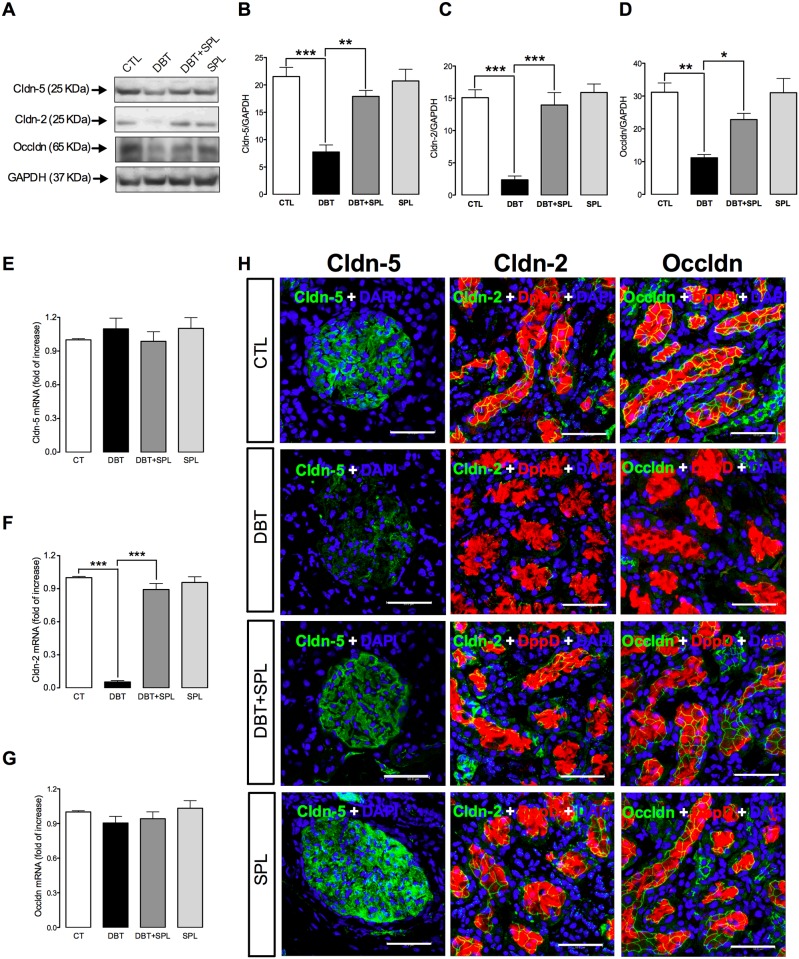
Fig 2. SPL treatment decreases diabetes-induced decrement in protein expression of cldn-5 in glomeruli (GL) and cldn-2 and occldn in proximal tubules (PT).
SPL prevents diabetes-induced decrease of cldn-5 protein expression (A and B) in GL, and mRNA (F) and protein expression of cldn-2 (A and C), and protein expression of occldn (A and D) in PT (S2 Fig). However, diabetes did not have effect in the mRNA levels of cldn-5 (E) and occldn (G) evaluated by qRT-PCR (S2 Fig). Additionally, cellular localization of cldn-2 and -5 and occldn were assessed by IF (H). SPL-treatment prevents diabetes-induced loss of cldn-5 (green label) in the cell borders of GL and, cldn-2 (green label) and occldn (green label) in the cell borders of PT labeled with DppD (red label), nuclei were marked with DAPI (blue label). No changes were found between CTL and SPL groups. GAPDH was used as loading control. Densitometric analysis of IBs from the four experimental groups are shown in panels B for cldn-5, C for cldn-2 and D for occldn. Data are mean±SEM from 3 rats per group. *p<0.05; **p<0.01 and ***p<0.001. Images are representative of three different experiments performed in the four experimental groups. Bar = 50 μm.

