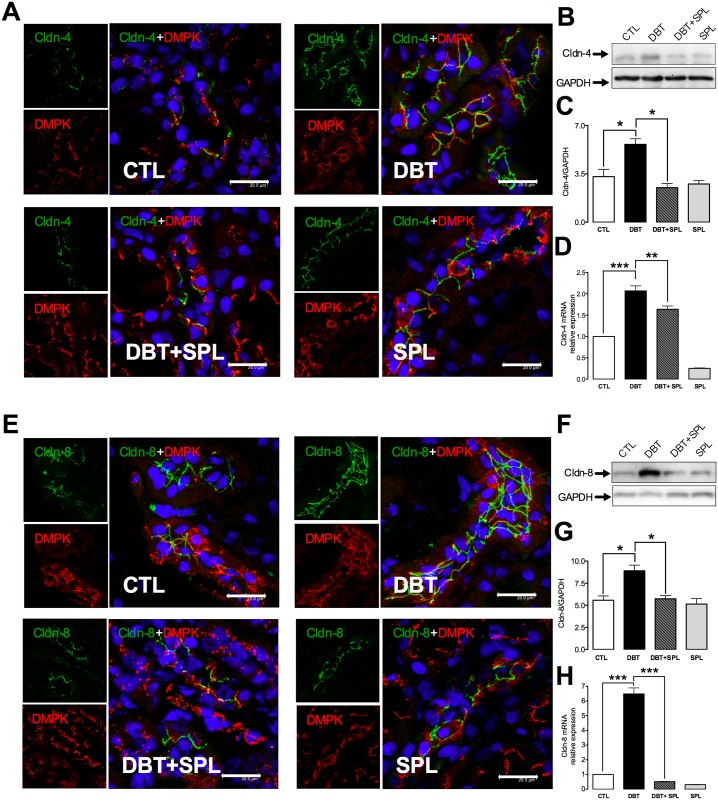
Fig 4. SPL treatment blunts diabetes-induced increment of protein and mRNA expressions of cldn-4 and -8.
SPL decreased diabetes-induced cldn-4 and -8 expressions evaluated by IF, IB and qRT- PCR. IF analysis shows that 3 weeks after diabetes induction, increased expressions of (A) cldn-4 (green label) and (E) cldn-8 (green label) were found in the TJs of DT labeled with desmoplakin (DMPK, red label). Nuclei were marked with DAPI (blue label). SPL treatment significantly decreased these changes. To confirm IF findings, IB and qRT-PCR analyzes were performed (S4 Fig). Diabetic condition significantly increased protein (B) and mRNA (D) levels of cldn-4; these changes were decreased by SPL treatment. Also, SPL treatment decreased diabetes-induced increased protein (F) and mRNA (H) levels of cldn-8. Similar results were found between CTL and SPL groups. GAPDH was used as loading control. Densitometric analyzes of IB from the four experimental groups are shown in panels C for cldn-4 and, G for cldn-8 (S4 Fig). Data are mean±SEM from 3 rats per group. *p<0.05; **p<0.01 and ***p<0.001. Images are representative of three different experiments performed in the four experimental groups. Bar = 20 μm.

