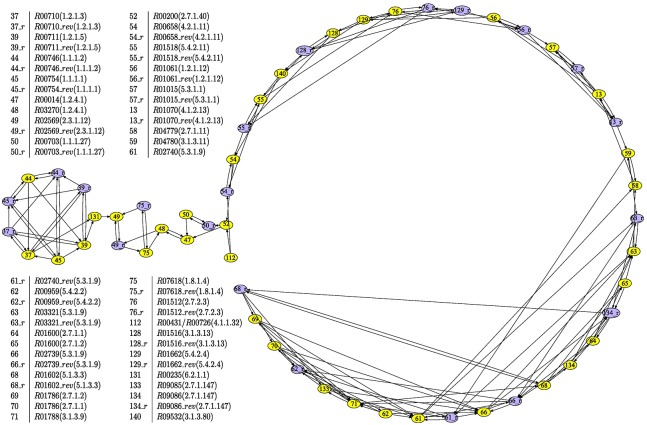
Fig 2. The reaction graph corresponding to the metabolic pathway of the glycolysis in Homo sapiens.
It shows the reaction graph corresponding to the metabolic pathway depicted on the left side of Fig 4. The nodes in this graph are the reactions of the pathway, depicted in blue nodes are the reverse of a reversible reaction and in yellow the reaction itself.

