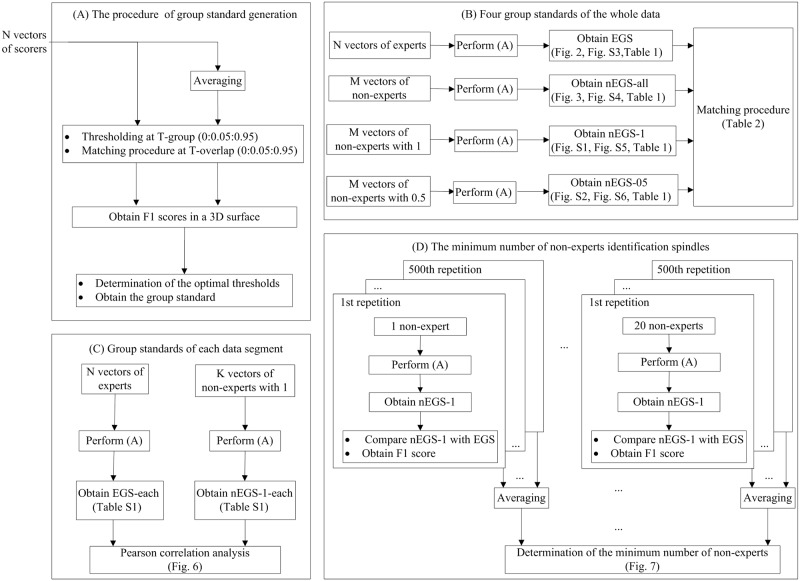
Fig 1. Schematic diagram of the analysis pipeline.
The pipeline is comprised by four blocks. In the first block (A), the method of generating group standard is elaborated. N vectors are averaged to obtain the group consensus. A group vector and N individual vectors were found by applying a group threshold (T-group = 0:0.05:0.95) to the group consensus and the N vectors. Using the matching procedure, the N individual vectors were compared with the group vector at varying overlap thresholds (T-overlap = 0:0.05:0.95) to obtain the F1 score. The mean F1 scores corresponding to varying T-group and T-overlap values were calculated by averaging the F1 scores of N scores. Finally, the optimal T-group was determined from the 3D surface by maximizing the mean F1 score of all individuals in the group, and the best T-overlap was selected by finding the first point at which the difference between the two adjacent values of the mean F1 score at the best T-group was more than 0.002. The group standard was then established from the group consensus at the optimal T-group. The second block (B) illustrates the establishment of four group standards (EGS, nEGS-all, nEGS-1 and nEGS-05) by performing the first block. The EGS (expert group standard) was generated from five experts. The nEGS-all (non-expert group standard with all spindles) was established from 168 non-experts when both definite spindles and indefinite spindles were considered. The nEGS-1 (non-expert group standard with definite spindles) was obtained from 168 non-experts when definite spindles were only considered. The nEGS-05 (non-expert group standard with indefinite spindles) was obtained from 168 non-experts when indefinite spindles were only considered. Then, the three non-expert group standards (nEGS-all, nEGS-1 and nEGS-05) are compared with EGS using a matching procedure. The third block (C) illustrates the establishment of group standards for each data segment (EGS-each and nEGS-1-each) by performing the first block. For each data segment (n = 30), the EGS-each (expert group standard of each data segment) was obtained from five experts. The nEGS-1-each (non-expert group standard of each data segment only containing the definite spindles) was established from 168 non-experts. Then, Pearson correlation analysis is performed between the performance of EGS-each and nEGS-1-each across 30 data segments. The fourth block (D) determines the minimum number of non-experts required to identify spindles. For each data segment, n (n = 1,2,3,…,20) non-experts identified the data. We generated the nEGS-1 from these n non-experts by performing the first block, and obtained the F1 score of nEGS-1 versus EGS using the matching procedure. This approach was repeated 500 times. The mean F1 score of nEGS-1 versus EGS was calculated across 500 repetitions. Then, we determined the minimum number of non-experts by finding the first point at which the mean F1 score of nEGS-1 versus EGS approached a stable value.

