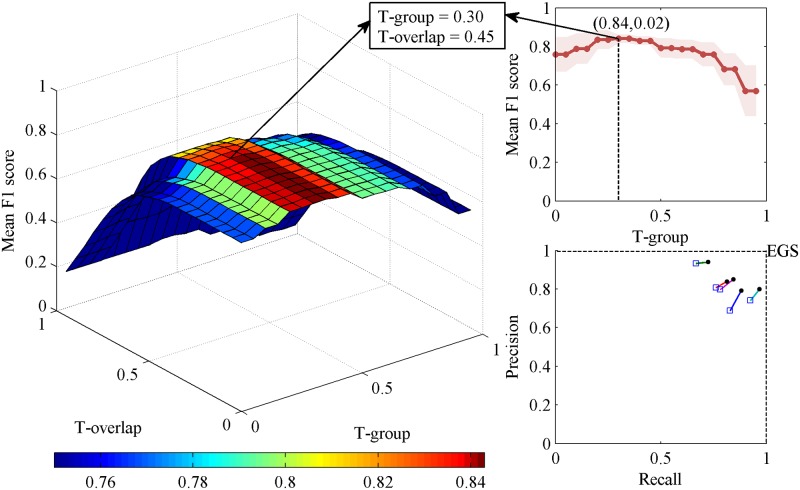
Fig 2. Generation of the expert group standard in stage N2.
Left: Three-dimensional plot of the mean F1 score of individual experts at varying group thresholds (T-group) and overlap thresholds (T-overlap). Top right corner: The mean F1 scores of experts at T-overlap = 0.45 with T-groups ranging from 0 to 0.95 at increments of 0.05. The highest average performance was at T-group = 0.30. The shading indicates the standard deviation. At T-group = 0.30 and T-overlap = 0.45, the mean F1 score shows a significant decreasing trend in the direction of the T-overlap axis, and the color clearly changes from dark red to orange (see left). This level of the expert group consensus was the expert group standard (EGS). Bottom right corner: A precision-recall plot of individual expert performance. Each square represents one expert. The square and the dot represent the performance with and without the leave-one-out method.

