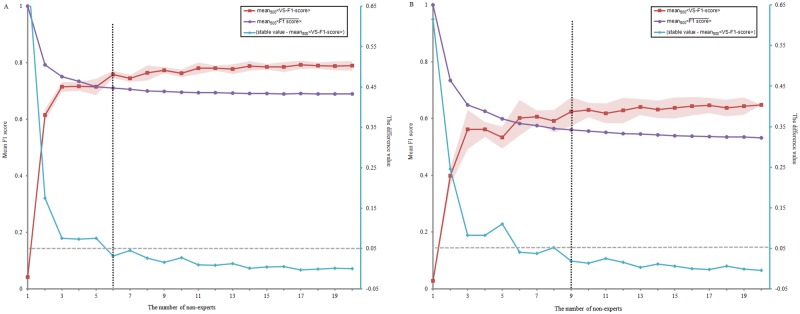
Fig 7. The performance of nEGS-1 with different numbers of non-experts identifying one sleep data.
(A) stage N2, (B) stage N3. n is the number of non-experts (n = 1,2,3,…,20). The red square indicates the mean performance of nEGS-1 versus EGS over 500 repetitions (mean500<VS-F1-score(n)>). The shading indicates the standard deviation. The purple circle indicates the mean F1 score of non-experts in nEGS-1 at the optimal thresholds over 500 repetitions (). The blue diamond (right ordinate) indicates the difference between the mean500<VS-F1-score(n)> of nEGS-1 and the stable value of the mean performance of the last three values in the red square line (stable value -mean500<VS-F1-score(n)>). The nEGS-1 is the non-expert group standard with definite spindles. The EGS is the expert group standard.

