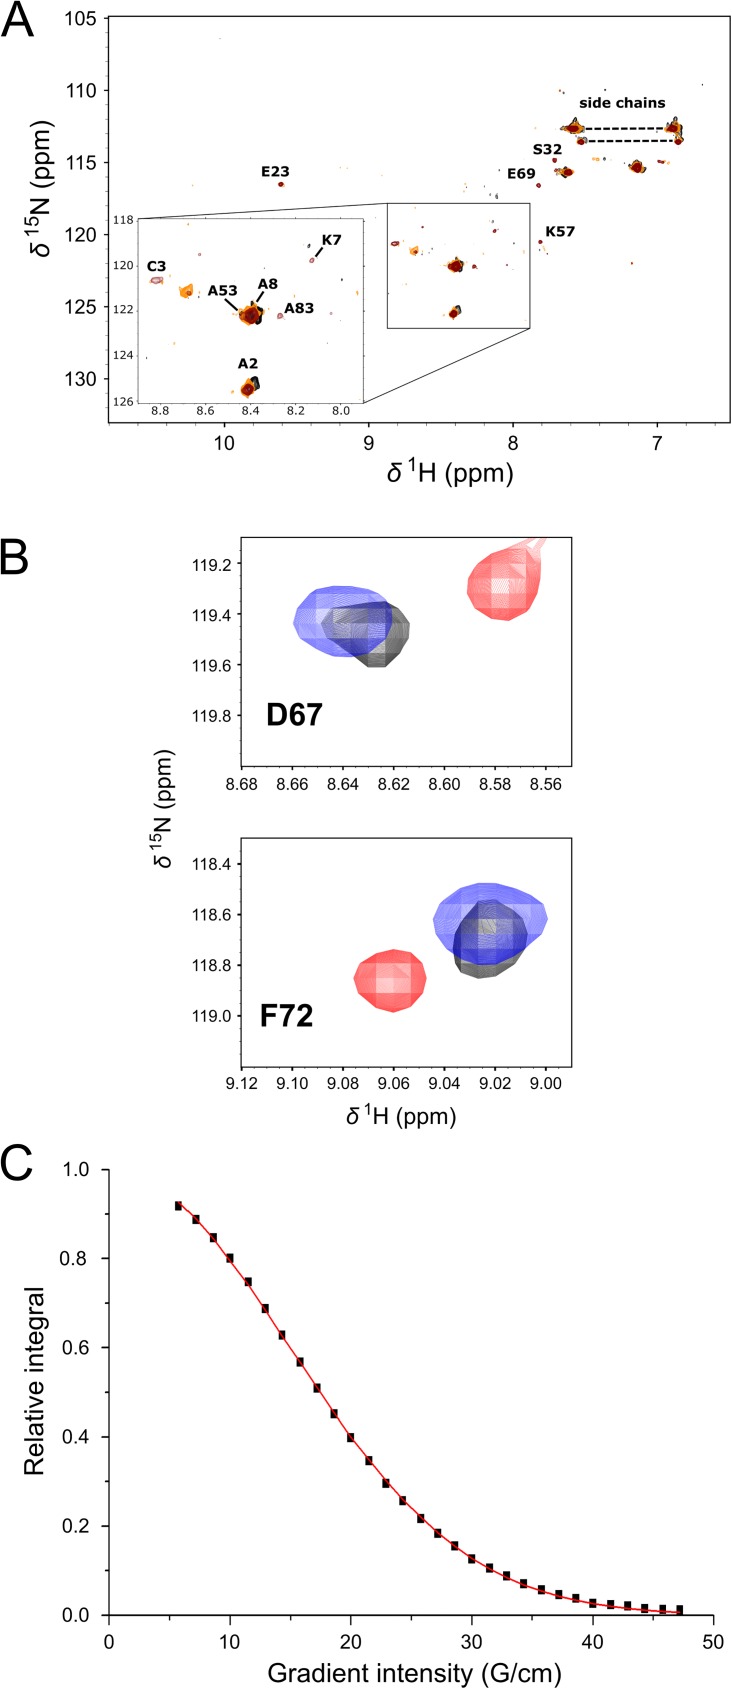
Fig 7. NMR spectroscopy analysis of the S100A4-N-ERMAD interaction.
(A) 1H-15N HSQC spectra of the 1:1 complex of the N-ERMAD: S100A4-Δ9 dimer (black) and upon addition of C-ERMAD present in 1:1 (orange) and 1:2 molar ratio (maroon). Note that most peaks are broadened below the detection limit. (B) However, successive addition of the C-ERMAD results in the appearance of peaks that coincide to the positions in the C-ERMAD-S100A4-Δ9 complex: Asp67 and Phe72. Free S100A4-Δ9 peaks are shown in red, peaks of the C-ERMAD-S100A4-Δ9 complex are blue, while the peaks of S100A4-Δ9 in the presence of both the N-ERMAD and the C-ERMAD in a molar ratio of 1:1 and 1:2, respectively, are black. (C) A typical translational diffusion experiment representation for the C-ERMAD- S100A4-Δ9 complex integrated in the 1.892–1.276 ppm region: the decay of integrated signal intensity-gradient strength where squares represent measured points and the fitted Stejskal-Tanner equation (that leads to the determination of diffusion constant) is presented in a continuous red curve.

