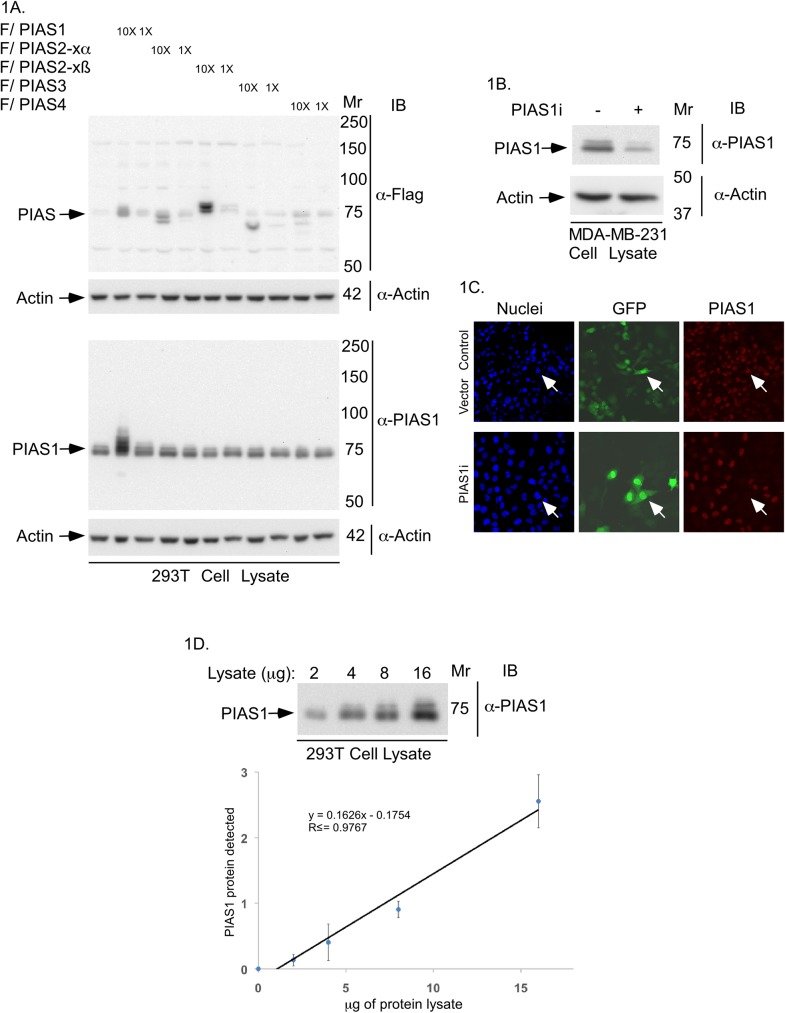
Fig 1. Characterization of the PIAS1 antibody.
(A) PIAS1 and actin-immunoblots of lysate of 293T cells expressing one of two different concentrations (1X or 10X) of FLAG-tagged PIAS1, PIAS2-xα, PIAS2-xβ, PIAS3 or, PIAS4, or transfected with the vector control. Actin immunoblotting was used as loading control. Only PIAS1 antibody-immunoreactive bands corresponding to endogenous PIAS1 and exogenous FLAG tagged-PIAS1 were detected. Immunoblots are from an experiment that was repeated twice with similar results. (B) PIAS1 or actin immunoblots of lysate of MDA-MB-231 cells transiently transfected with an RNAi vector control or receiving a pool of plasmids expressing short hairpin RNAs against two distinct regions of PIAS1 [18,19]. Control and PIAS1 RNAi plasmids also express CMV-driven green fluorescence protein (GFP). Immunoblots are from an experiment that was repeated twice with similar results. (C) Representative PIAS1 (red), GFP (green) and nuclei (blue) fluorescence microscopy micrographs of MDA-MB-231 cells transfected as in B, and subjected to anti-PIAS1 indirect immunofluorescence and counterstained with Hoechst 33342 fluorescent nucleotide dye to visualize nuclei. GFP signal indicate control vector or PIAS1 RNAi plasmid-transfected cells. Arrow shows an example of each a vector transfected cell (upper row) and a PIAS1 RNAi transfected cell (lower row) to highlight the knockdown of endogenous PIAS1 in PIAS1i-transfected cell. These experiments were repeated two times with similar outcomes. (D) Representative PIAS1 immunoblots of serially-diluted lysate of 293T cells (upper panel), and protein abundance of PIAS1 quantified by densitometry (y-axis) plotted versus the protein amount of lysate (x-axis) (lower panel). The abundance of PIAS1 for each point in the XY graph is the mean ± SEM from three independent experiments including the one shown in upper panel. Regression analysis indicated that the protein abundance of PIAS1 follows a linear relationship with total protein amount in cells lysates.

