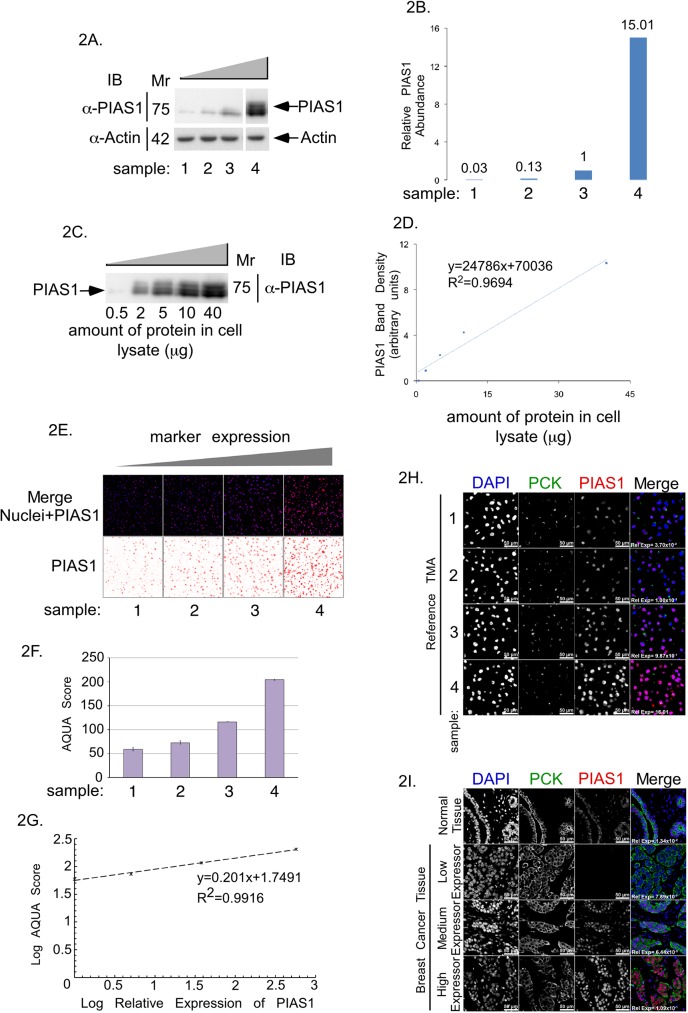
Fig 2. PIAS1 protein abundance analysis in reference TMA and breast cancer TMA.
(A) PIAS1 and actin immunoblots of lysate of MDA-MB-231 cells expressing four increasing concentrations of PIAS1 (samples 1 to 4). (B) Bar graph of actin-normalized PIAS1 protein abundance in samples 1 to 4 shown in A and expressed relative to actin-normalized PIAS1 abundance in sample 3. (C) PIAS1 immunoblot of serially diluted lysate of MDA-MB-231 cells overexpressing PIAS1 in sample 4. (D) XY-graph plot of the lysate's total protein on the x-axis versus PIAS1 protein abundance, quantified from PIAS1immunoblot in C, on the y-axis. (E) Representative PIAS1 (red), and nuclei (blue) fluorescence micrographs of sections of Histogel-embedded MDA-MB-231 cells reference TMA expressing increasing abundance of PIAS1, corresponding to samples 1 to 4 in panel A, which were subjected to anti-PIAS1 indirect immunofluorescence and DAPI dye staining to visualize nuclei. (F) Bar graph depicts AQUA analysis software-quantified PIAS1 abundance in the reference TMA shown in E. (G) The XY-graph shows the relationship between Log of relative abundance of PIAS1 in samples 1 to 4 of MDA-MB-231 cell lysates quantified by immunoblotting on the x-axis versus Log of abundance of PIAS1 in MDA-MB-231 samples 1 to 4 of reference TMA quantified by AQUA analyses of immunocytochemistry on the y-axis. (H) Representative fluorescence microscopy micrographs of histogel-MDA-MB-231 cell reference TMA blocks. (I) Representative fluorescence microscopy micrographs of paraffin-embedded normal breast tissue and examples of three breast cancer tissues expressing different amounts of PIAS1. For both H and I, TMA were subjected to anti-PIAS1 (red) and anti-Pan cytokeratin (green) antibodies indirect immunofluorescence, and nuclear counterstaining with DAPI (blue). PIAS1-Cytokeratin-Nuclei merged fluorescence micrograph panels show relative abundance of PIAS1 in reference breast cancer TMA, normal breast and breast cancer tissue array.

