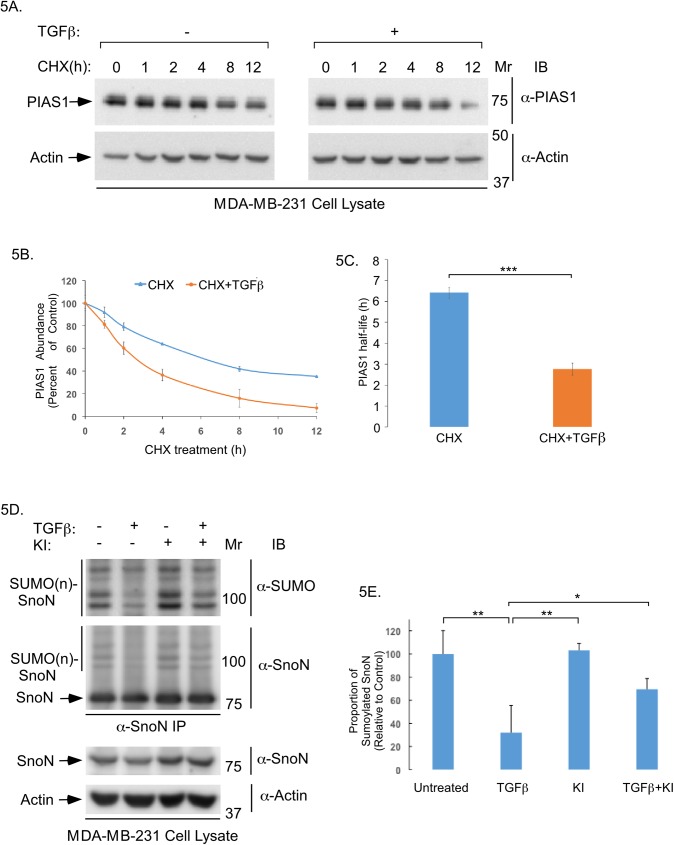
Fig 5. TGFβ regulates PIAS1 protein stability and SnoN sumoylation abundance in breast cancer cells.
(A) PIAS1 and actin immunoblots of lysates of MDA-MB-231 cells pre-incubated without or with 100pM TGFβ for 12 hours prior to treatment with 10μg/ml cycloheximide (CHX) for 0, 1, 2, 4, 8 and 12 hours (h). (B) An XY-graph of CHX treatment (h) on x-axis versus mean ± SEM (n = 3 experiments including one shown in A) of relative actin-normalized PIAS1 abundance in cells pre-incubated without (blue line) or with TGFβ (red line) on the y-axis. TGFβ increases the PIAS1 protein abundance turnover. (C) Bar graph represents the mean ± SEM of PIAS1 protein half-life in MDA-MB-231 cells pre-incubated without (blue) or with TGFβ (red) quantified from three-independent experiments including from the experiment shown in A. Half-life of PIAS1 protein was determined from graph shown in B by interpolation. TGFβ reduced PIAS1 protein half-life by 57%. (D) SUMO1 and SnoN immunoblots (panels 1 and 2) of NEM-treated SnoN immunoprecipitation (SnoN IP) of lysate of SnoN-expressing MDA-MB-231 cells incubated for 12 hours without or with TGFβ, KI, alone or together. Unmodified SnoN has a MW of 77 KDa (arrow), and sumoylated SnoN protein species run as 100 KDa and higher as detected in SUMO and SnoN immunoblots of SnoN immunoprecipitation (SUMO(n)SnoN, vertical lines) [12,18]. SnoN and actin immunoblots (panels 3 and 4) of lysates of cells treated as described above for panels 1 and 2 are also shown. (E) The bar graph represents the mean ± SEM of proportion of sumoylated SnoN relative to unmodified SnoN quantified from SnoN immunoblots of SnoN immunoprecipitation and expressed relative to the proportion of sumoylated SnoN in the untreated control from three independent experiments including the one shown in D. TGFβ-signalling reduces the proportion of sumoylated SnoN by 68% in MDA-MB-231 cells. Statistical difference, (C) Student t-test: ***P≤ 0.001, (E) ANOVA: **P≤0.01, *P≤0.05.

