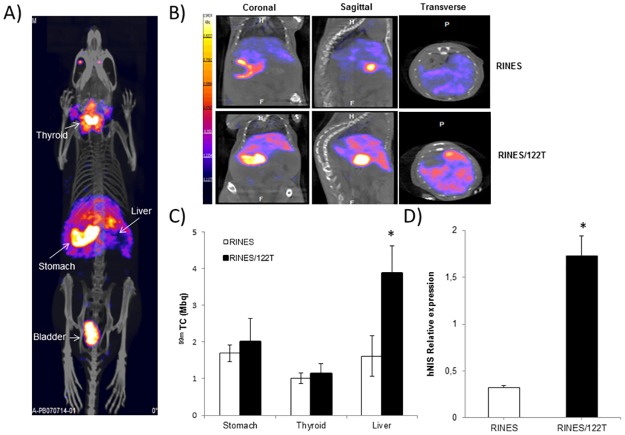
Fig 5. SPECT/CT imaging of miRNA-122 expression in the liver of mice.
(A) A representative fused whole-body SPECT/CT image collected from one mouse injected hydrodynamically with the pRINES/122T plasmid. (B) Representative sagittal, coronal and transverse SPECT/CT images collected from the liver of one mouse from the pRINES and pRINES/122T group of mice. (C) Quantification of 99mTc04- uptake in ROIs covering the liver of mice of the pRINES and pRINES/122T group of animals. (D). Quantitative RT-PCR analysis of hNIS transcript detected in the liver of 3 mice collected randomly from the pRINES and pRINES/122T group of animals. Error bars in C are the mean ± SEM (n = 5) of one representative experiment performed at least two times. Error bars in D are the mean ± SD (n = 3) of one representative experiment performed at least three times. Statistics by the two-tailed t-test, * P ≤ 0.05 compared with the pRINES control group.

