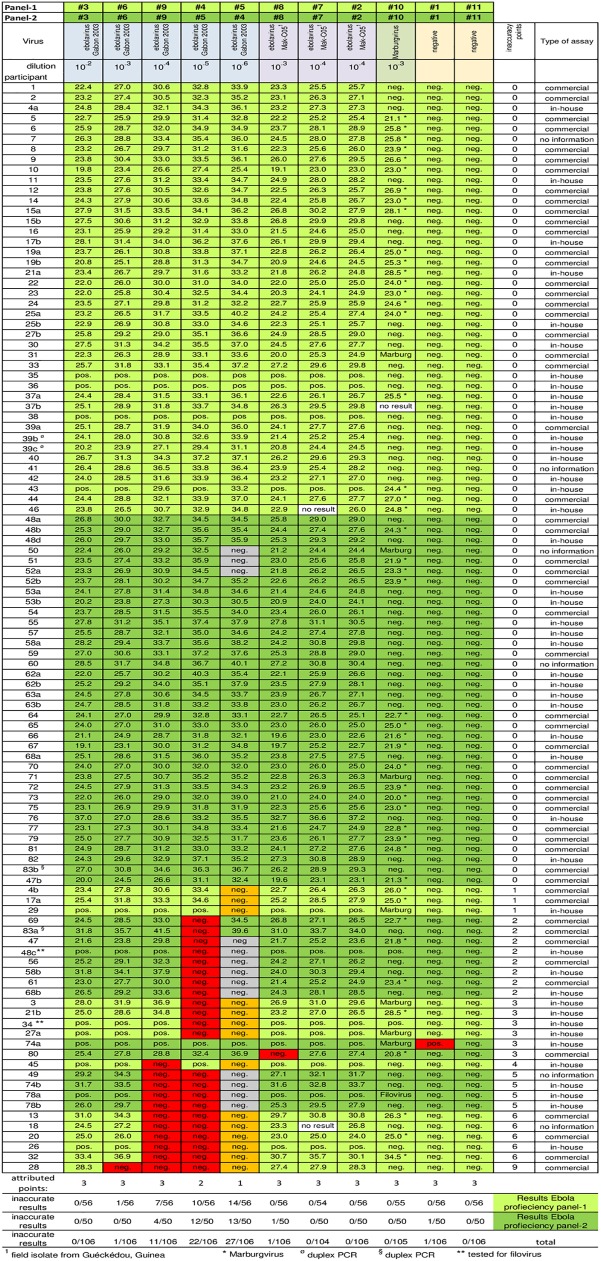
Fig 2. Representation of PCR results for ebola PCR-EQA.
PCR results from all participants were collected, either as Cq values (when reported) or as positive or negative according to the report received. Sample type and dilution step of initial virus stocks are given at the top. The different categories approached in the EQA (sensitivity, specificity, reproducibility, contamination) are color coded according to Fig 1. Results received for panel-1 are shaded in light green. Results for panel-2 are shaded in dark green. False-positive and false-negative results are color coded. False-negative results for the lowest copy number (orange) were attributed 1 point (only panel-1), for the second lowest 2 points and all other false-negative as well as false-positive results received 3 points (all red). Coded participants are ranked according to their scores. The type of assay used for virus detection is shown in the column to the right. Three shipped panel sets had been incomplete and for the missing sample no result was obtained (white). For these samples as well as for the highest dilution for panel-2 (grey) no points were attributed.

