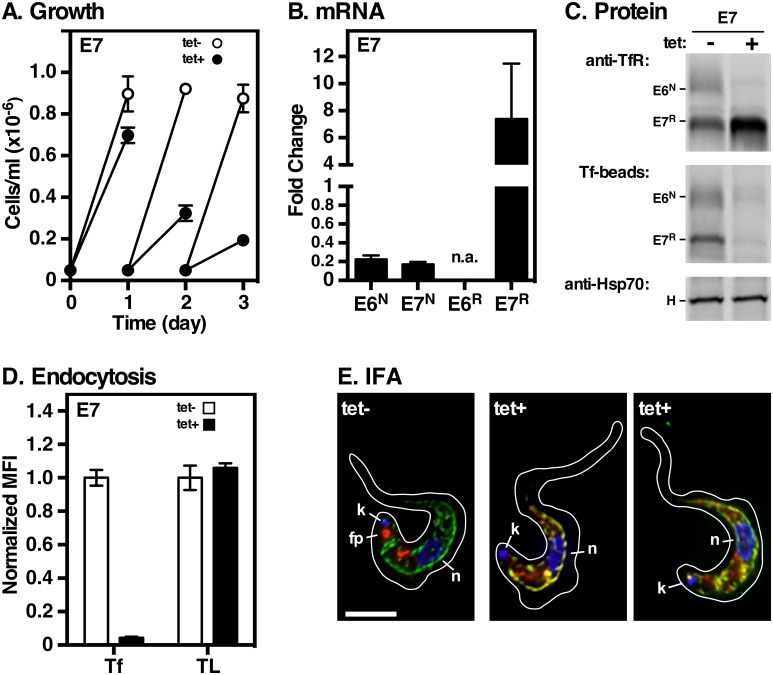
Fig 3. Expression and function of E7R alone.
The parental TfR RNAi cell line containing RNAi resistant E7R was cultured without (tet-) or with (tet+) tetracycline. A. Cell density was measured as in Fig 2. Data are means ± SEM (n = 3). All subsequent analyses were performed at 24 hrs of silencing. B. Levels of native E6N, E7N and RNAiR E7R transcripts were determined by qRT-PCR as in Fig 2; n.a indicates not assayed. Results are normalized to un-induced controls and are presented as fold-change for three biological replicates (mean ± SEM.). C. E7 cells were pulse radiolabeled as in Fig 2, and pull-downs performed with anti-TfR, Tf-beads, and anti-HSP70. The mobilities of E6, E7 and HSP70 (H) are indicated. All images are representative of three independent biological replicates. D. Receptor mediated uptake of fluorescent transferrin (Tf) and tomato lectin (TL) was measured by flow cytometry. Data are presented as median fluorescent intensity (MFI ± SEM.) for three biological replicates and are normalized to un-silenced control cells. E. IFA of the E7R cell line without (tet-) or with (tet+) tetracycline as in Fig 2 with anti-BiP (green), anti-TfR (red), and DAPI (blue) to detect nucleus (n) and kinetoplast (k). As appropriate, flagellar pocket localization of TfR is indicated (fp). Deconvolved three-channel summed stack projections of one (tet-) or two (tet+) representative cells. Cell outlines were traced from matched transmitted light images. Bar = 4 μm.

