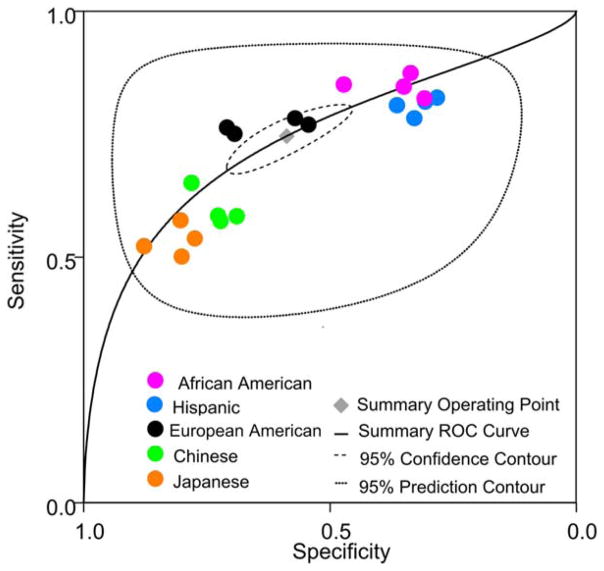
FIGURE 2.
The summary ROC curve for discriminative performance of WHtR boundary value of >0.50 (Browning et al., 2010) to screen for patients with high risk of cardiometabolic conditions. Each marker represents one of the 4 cardiometabolic outcomes: subclinical inflammation, hypertension, dyslipidemia, prediabetes/diabetes, whereas the marker colors indicate race/ethnic groups

