
Figure 4. TCA Cycle Activity Underlies Phenotypic Sensitivity to Tobramycin Treatment.
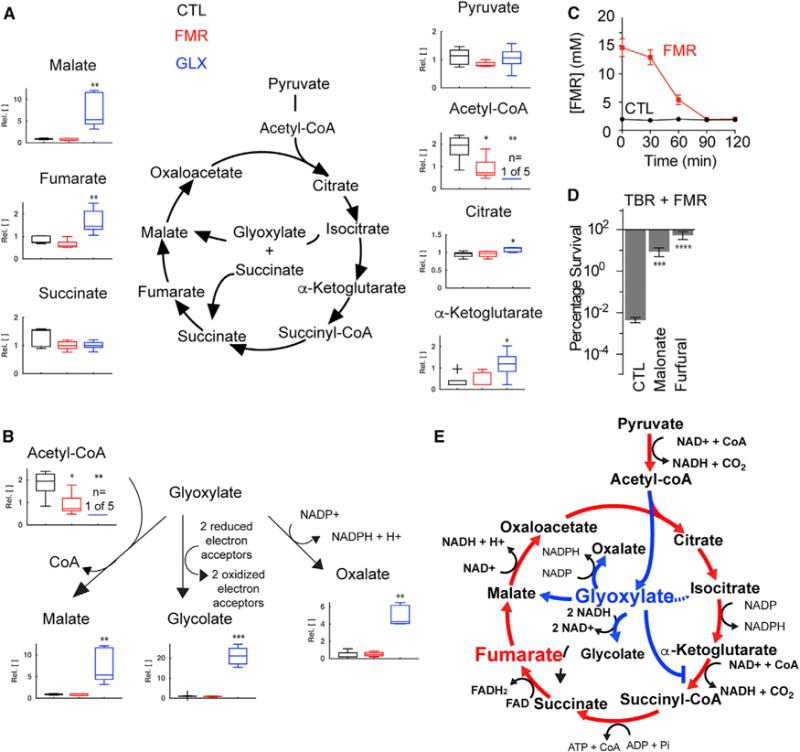
(A) Abundance of TCA cycle metabolites quantified by metabolite profiling of stationary-phase PAO1 cells with 15 mM fumarate (FMR), 30 mM glyoxylate (GLX), or no treatment (CTL). Values depict relative concentration measurements with significance reported as p values in comparison with untreated control (CTL) with FDR-computed q values ≤0.1: *p ≤ 0.05, **p ≤ 0.01 (n = 5).
(B) Abundance of downstream metabolic products of glyoxylate, quantified by metabolite profiling. Values depict relative concentration measurements with significance reported as p values in comparison with untreated control (CTL) with FDR-computed q values ≤0.1: *p ≤ 0.05, **p ≤ 0.01, ***p ≤ 0.001 (n = 5).
(C) Extracellular fumarate consumption following supplementation of stationary-phase cells with 15 mM fumarate.
(D) Effects of TCA cycle inhibition by 10 mM malonate or 10 mM furfural on fumarate-mediated tobramycin resensitization. Survival of stationary-phase cells following 4 hr treatment of 40 mg/L tobramycin with 15 mM fumarate supplementation. Values depict the mean ± SEM with significance reported as FDR-corrected p values in comparison with CTL: ***p ≤ 0.001, ****p ≤ 0.0001 (n = 3).
(E) Summary schematic depicting TCA cycle utilization following treatment with fumarate (red) or glyoxylate (blue).