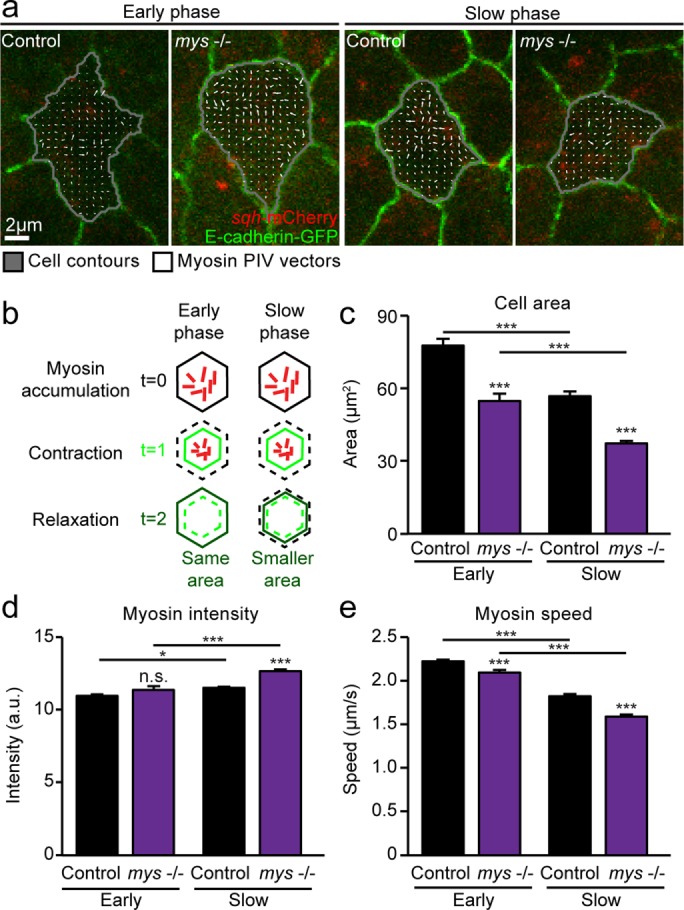
FIGURE 1:

Myosin dynamics in AS cells are perturbed in the absence of cell–ECM adhesion. (a) Images from z-projected time-lapse movies of control and mys −/− embryos expressing E-cadherin–GFP and sqh-mCherry during the early and slow phases of DC, with overlaid cell contours and PIV vectors representing myosin movement over 20 s. Vectors are uniformly scaled across samples. (b) Schematic illustrating cell area oscillations at early and slow phases of closure. Myosin accumulation drives cell contraction, and, as pulses dissipate, the cell relaxes either to the same area (early phase) or to a smaller area (slow phase). (c–e) Mean apical cell area (c), mean myosin intensity (d), and medial myosin speed measured by PIV (e) in control and mys −/− embryos at early and slow phases of closure (two to four embryos, 26–78 cells). Error bars indicate SEM. *p < 0.05, ***p < 0.0001.
