FIGURE 2:
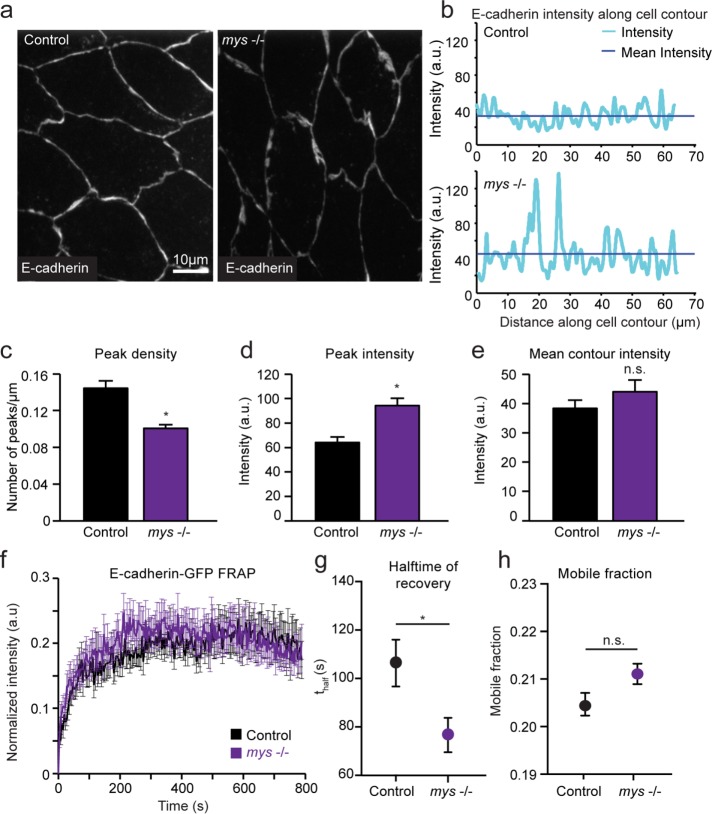
Cadherin localization and stability is disrupted in mys −/− mutants. (a) Sample z-projected images of control and mys −/− embryos fixed during the early phase of DC and stained for E-cadherin. (b) Quantification of E-cadherin staining intensity along the entire cell contour for sample cells in control and mys −/− embryos. (c) Mean density of E-cadherin intensity peaks along cell contour measured as number of peaks per micrometer for control and mys −/− embryos. (d, e) Mean peak intensity and mean overall E-cadherin intensity along cell contour for control and mys −/− embryos (three embryos, 8–11 cells). (f–h) Mean FRAP curves (f), half-time of fluorescence recovery (g), and mobile fraction (h) for control and mys −/− embryos (10–12 embryos). Error bars indicate SEM. *p < 0.05.

